Read a link’s click report and export it
See how many people clicked a short link, find its busiest day, and download the numbers.
- 6 steps
- About 5 minutes
Before you start
- A short link that has already been clicked a few times.
- Links Pro, or a business vault that includes link analytics.
Step 1: Open the link’s analytics
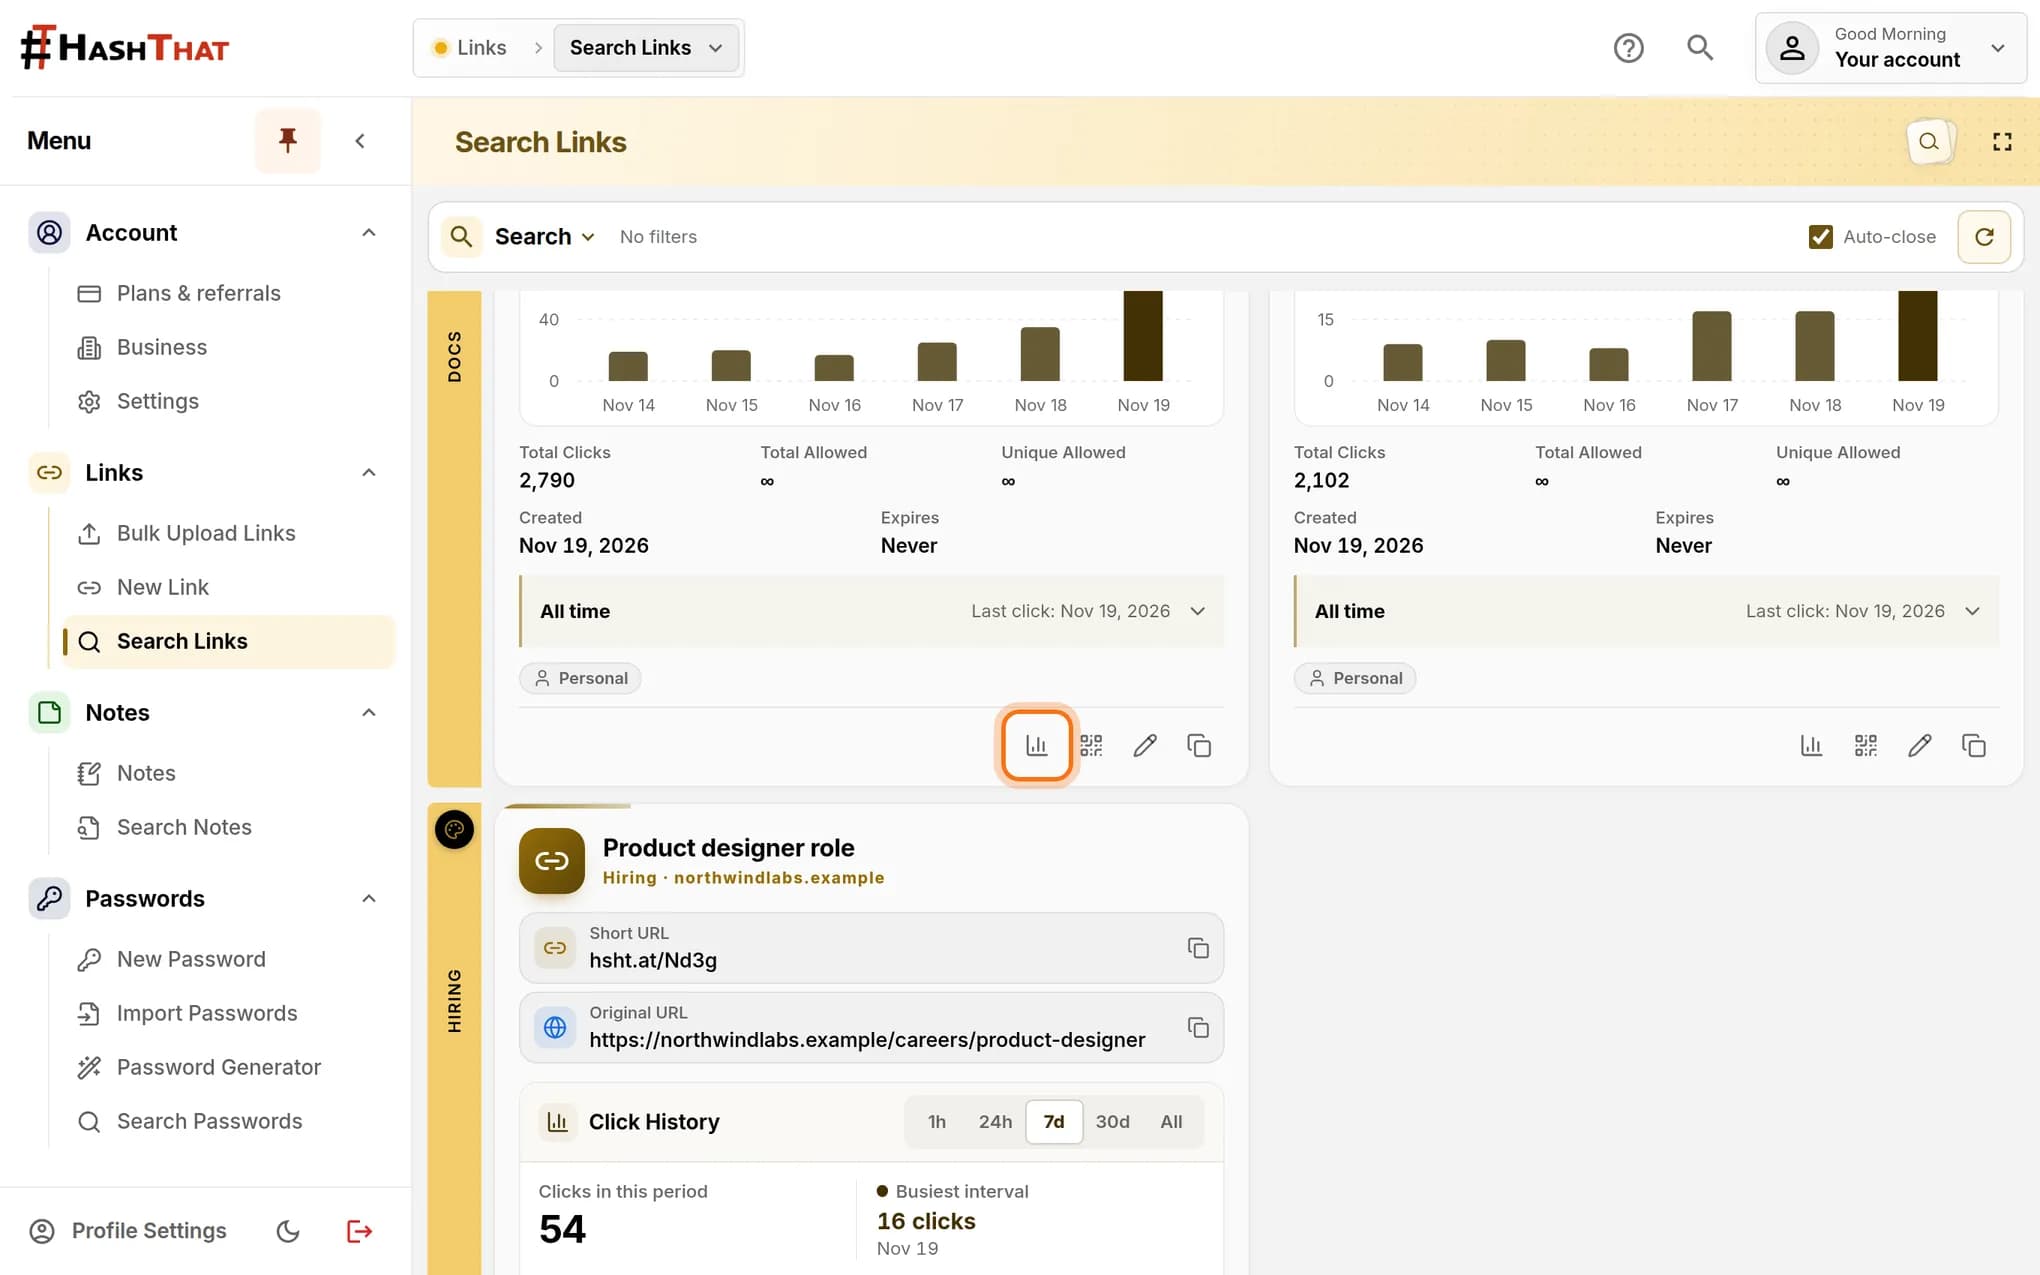
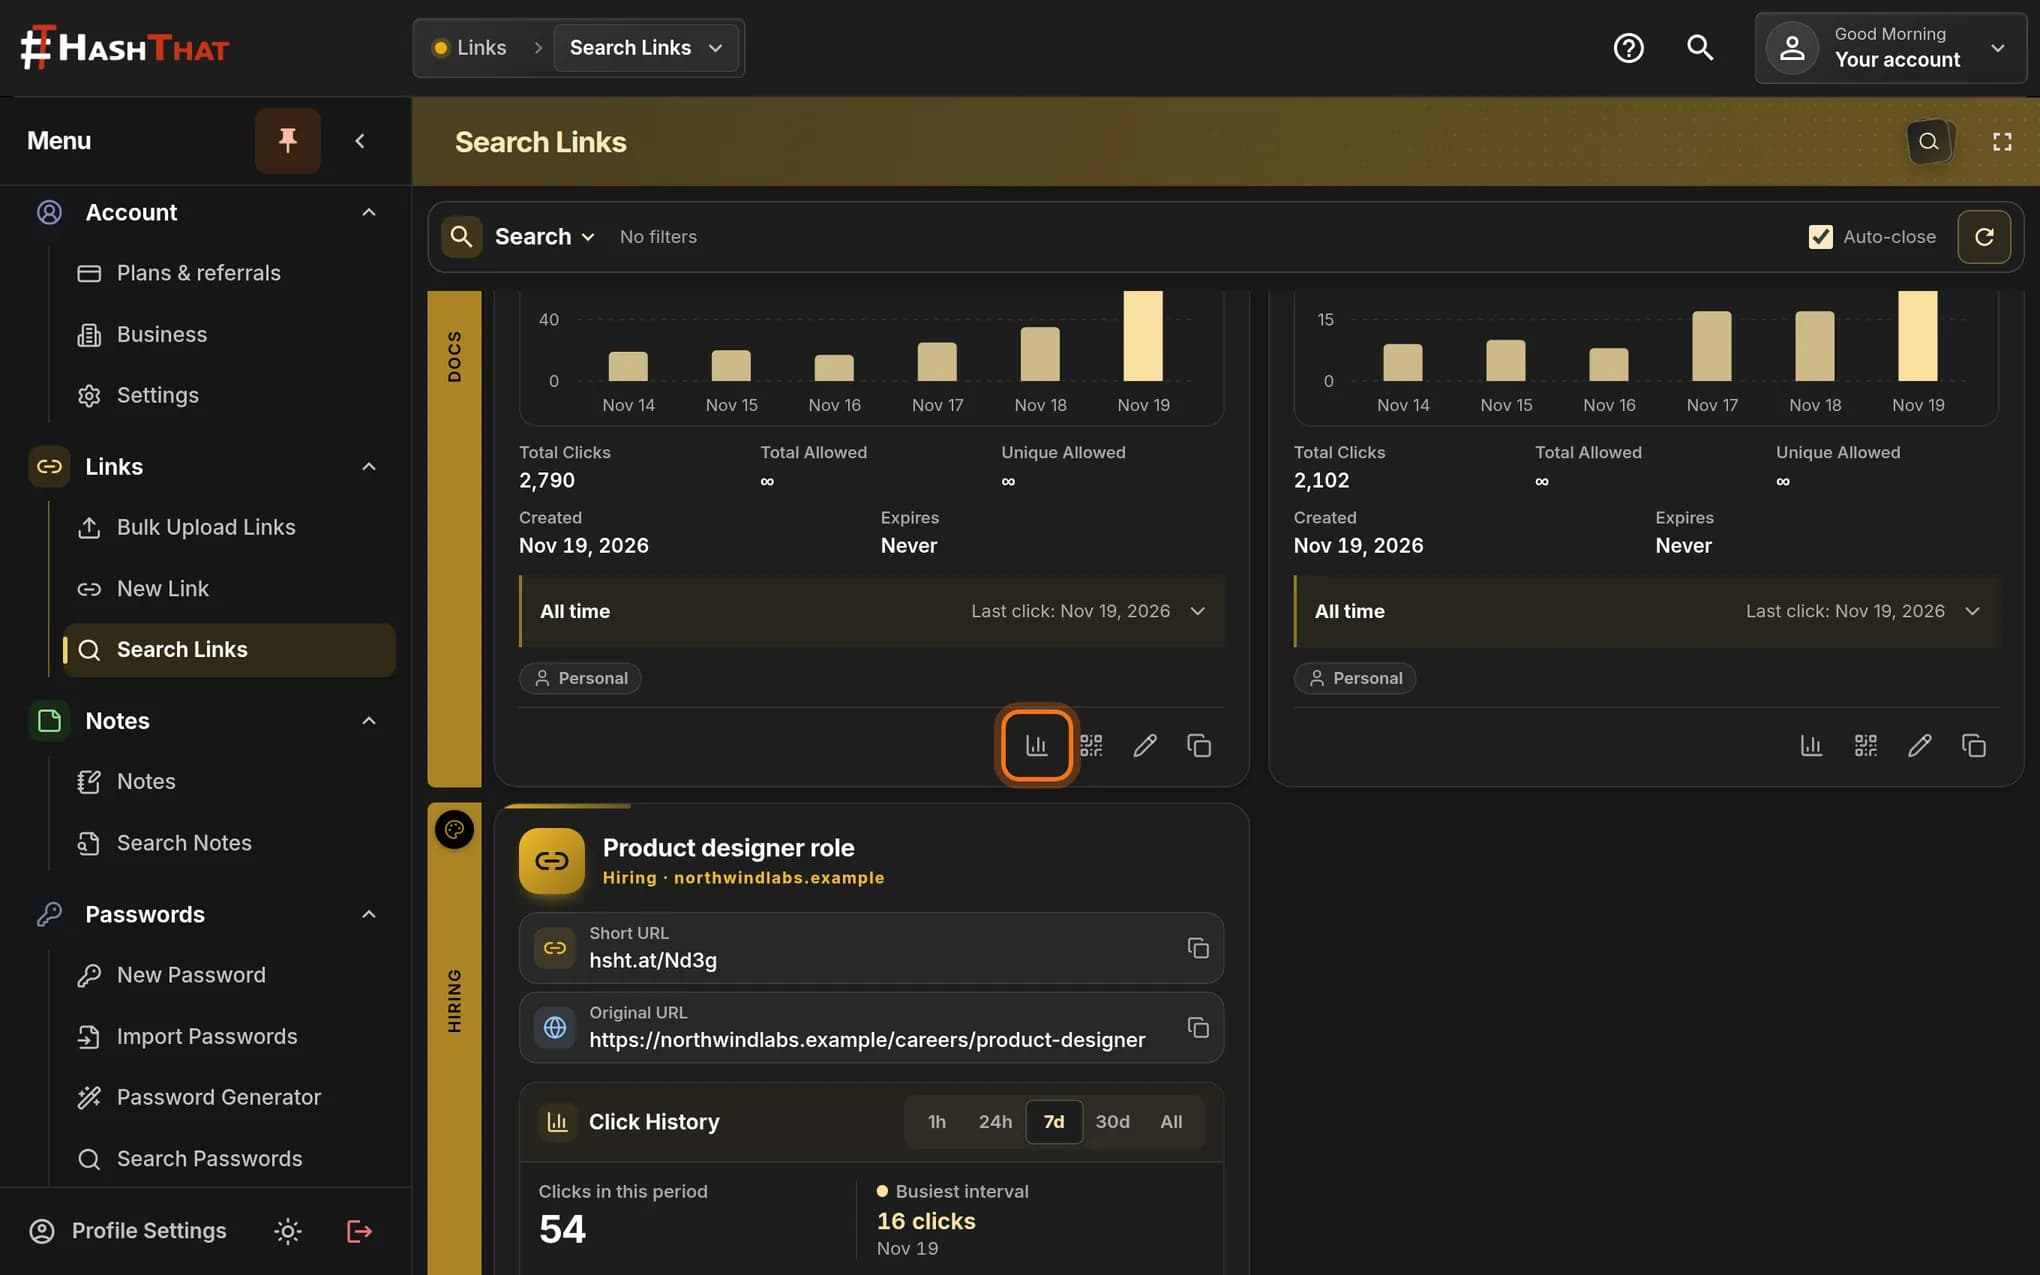
- In the left menu, click Search Links.
- Find the card of the link you want to look at.
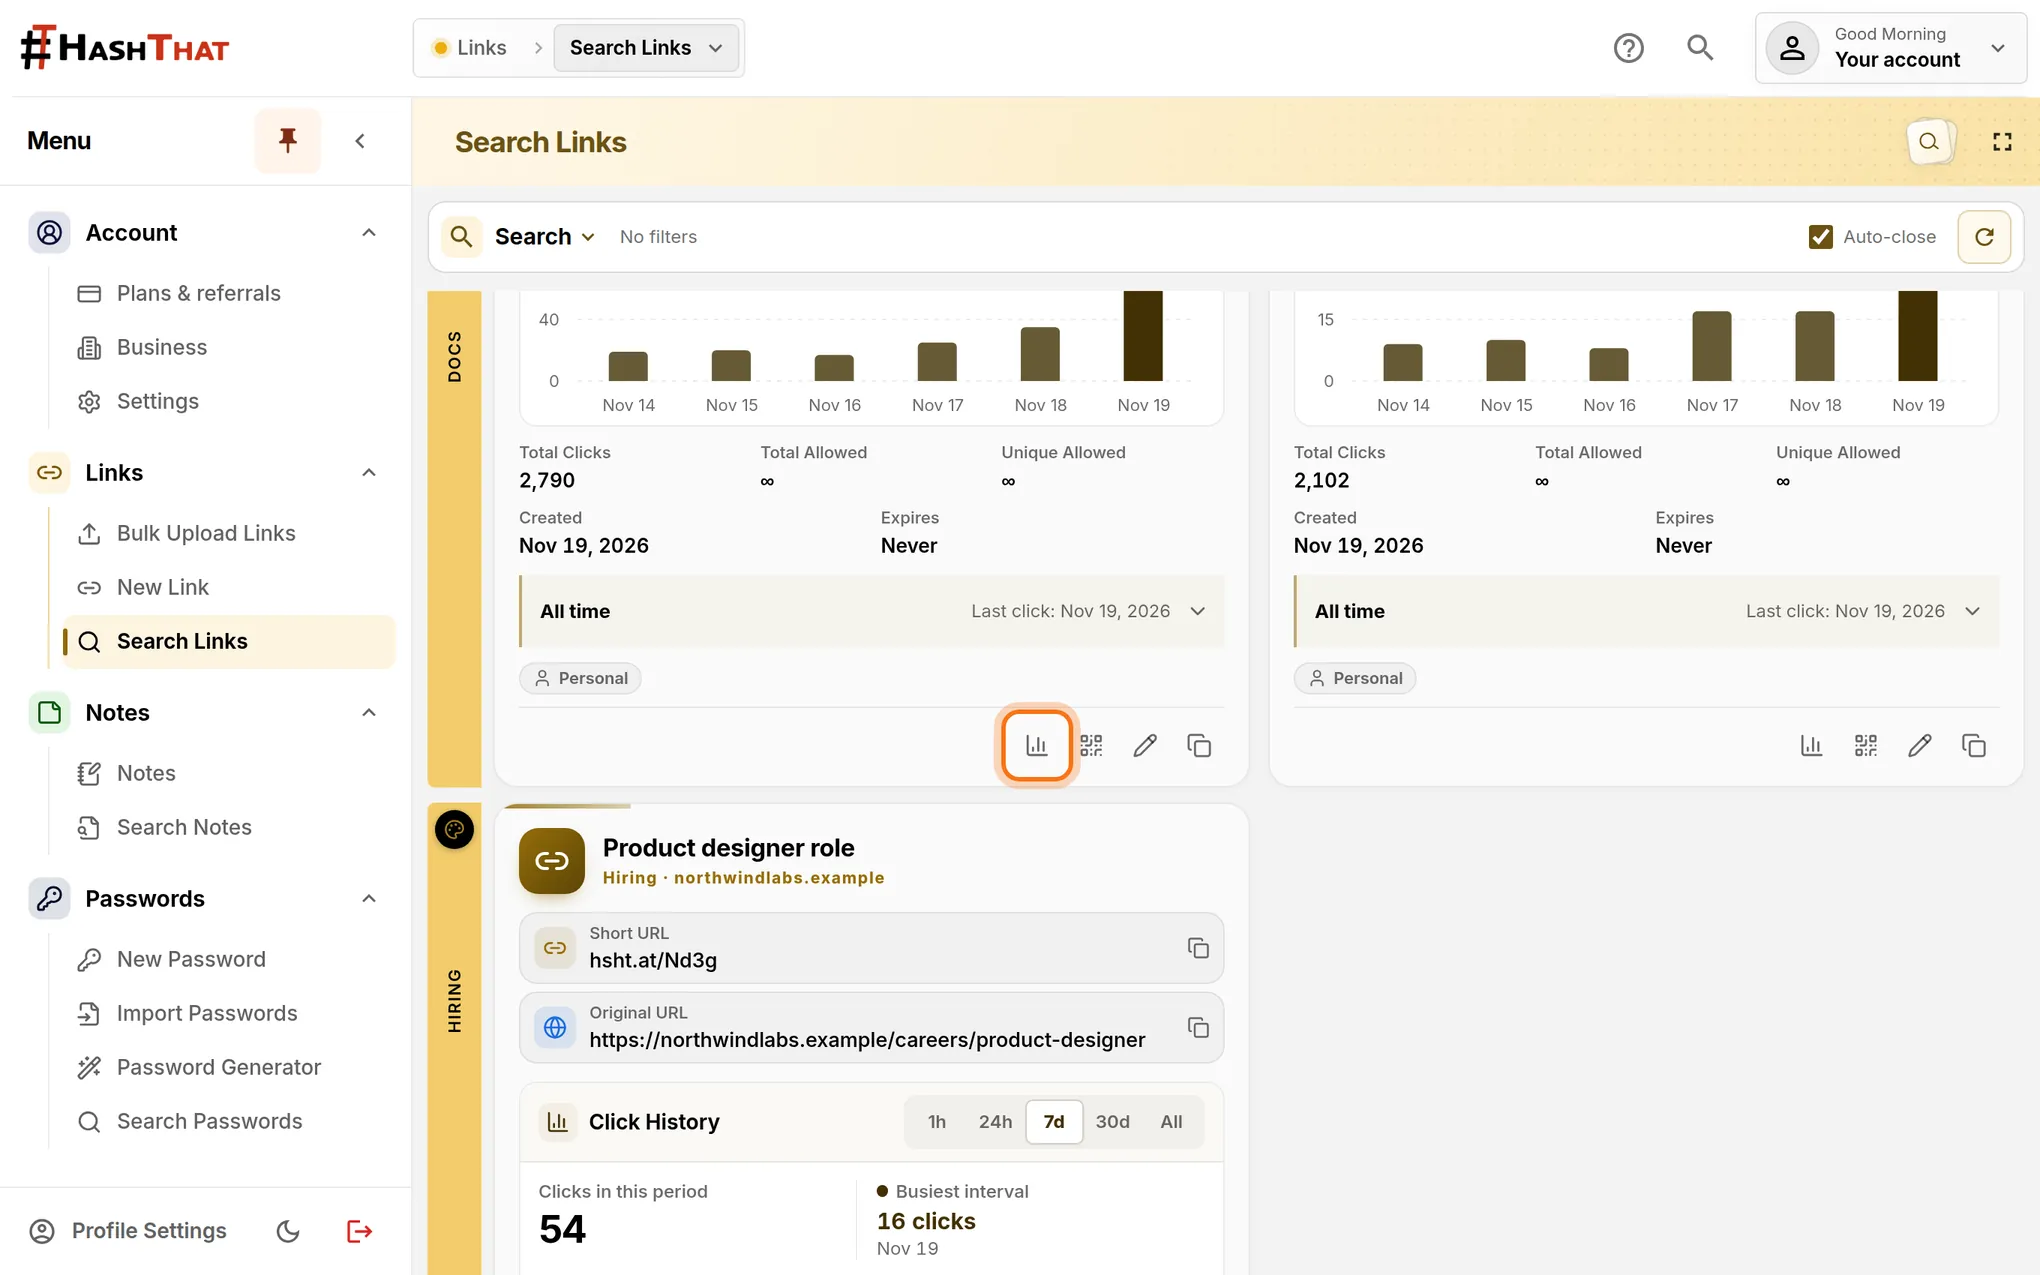
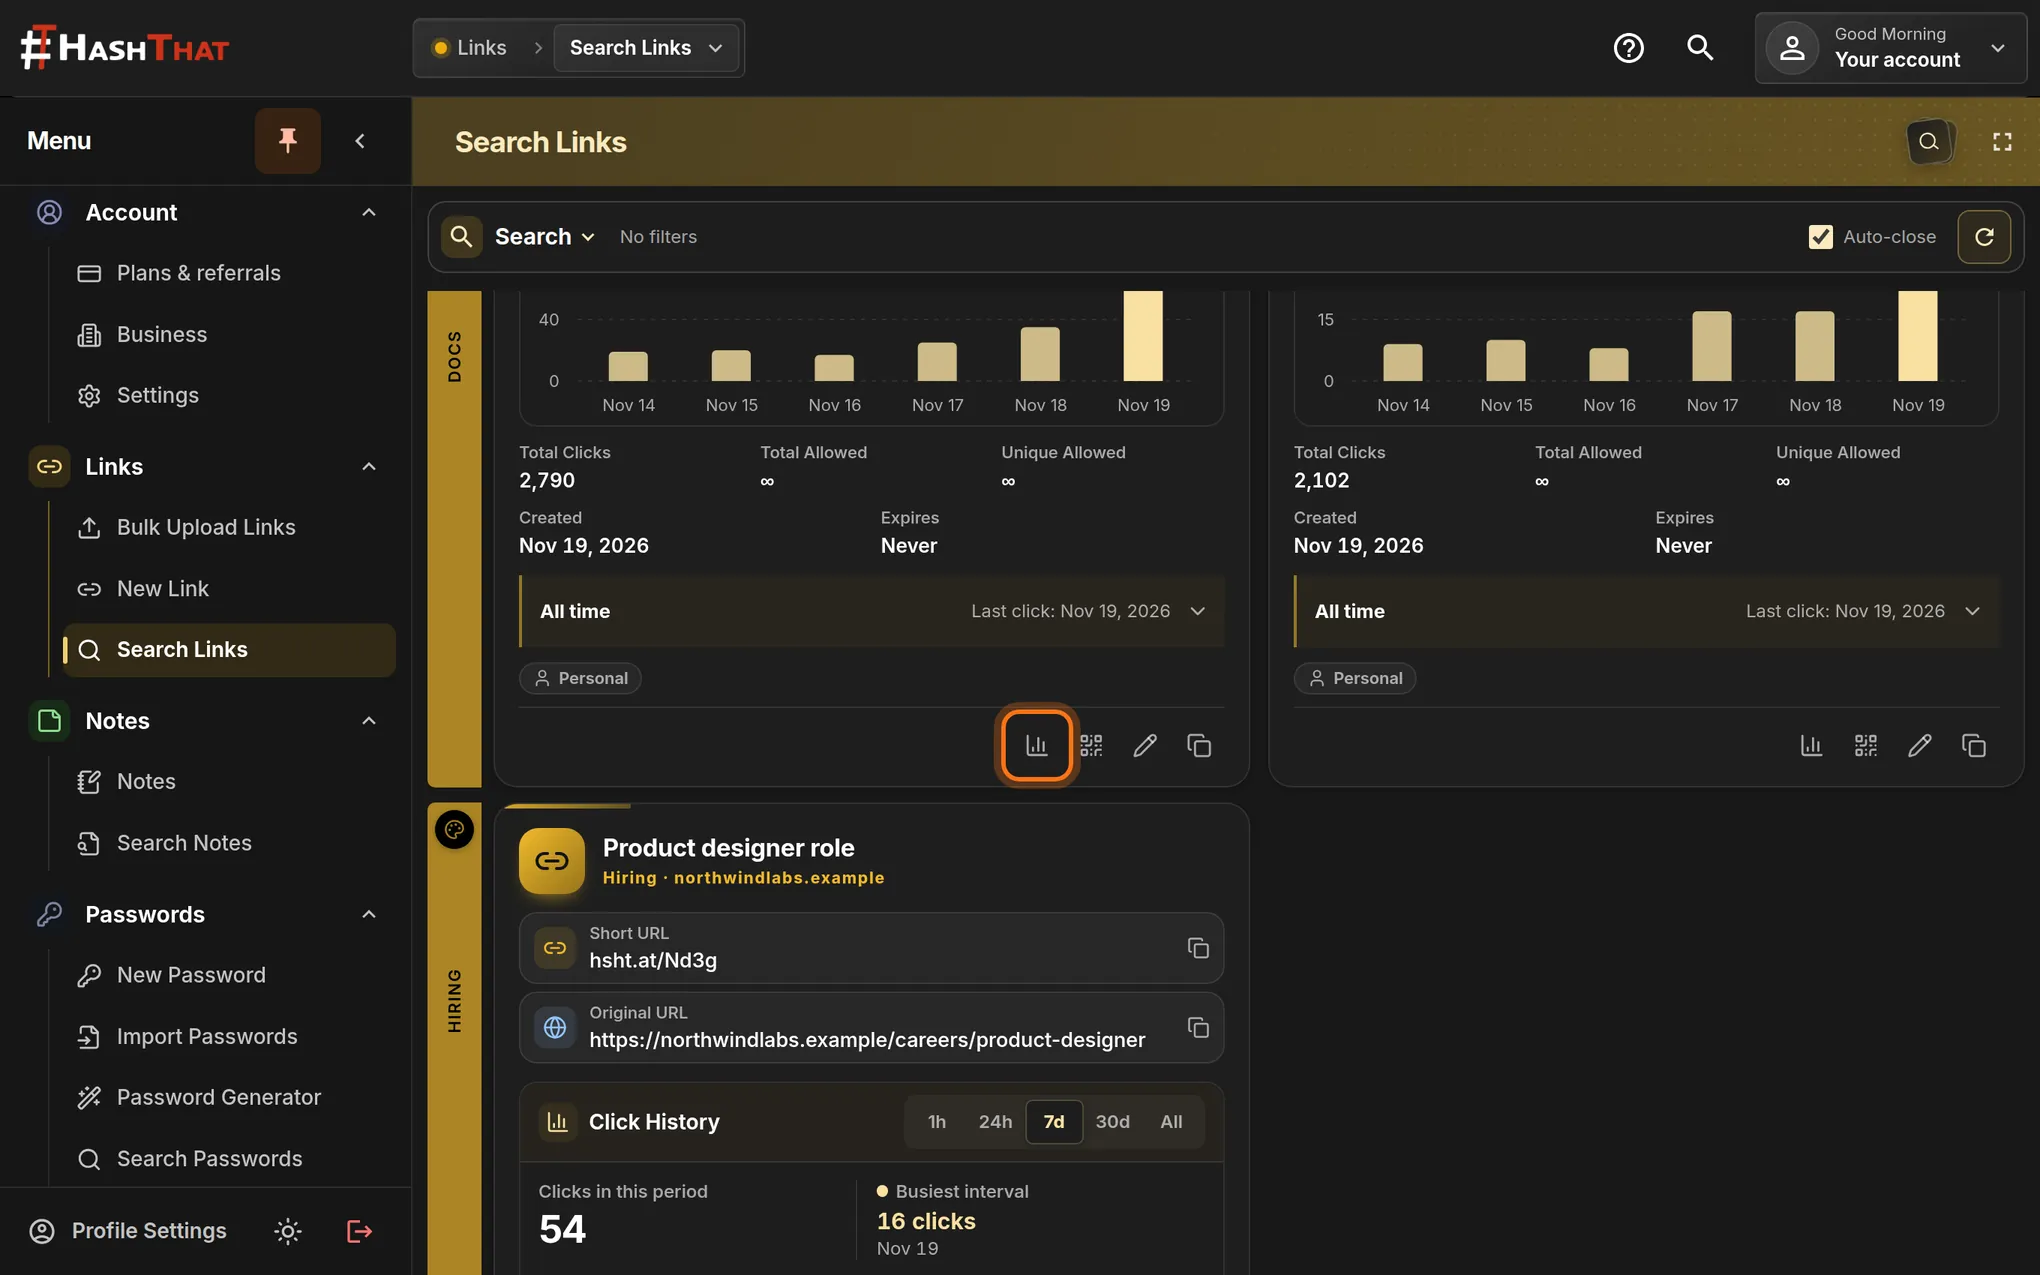
- At the bottom of the card, click the small chart icon. Its name is View Detailed Analytics.
You should see: A page titled Link Analytics with the link’s name in a dark banner.
 Full size
 Full size
The chart icon is the first of the four icons at the bottom of a link card. Step 2: Choose the period
- Check the name and address in the banner, so you know you are reading the right link.
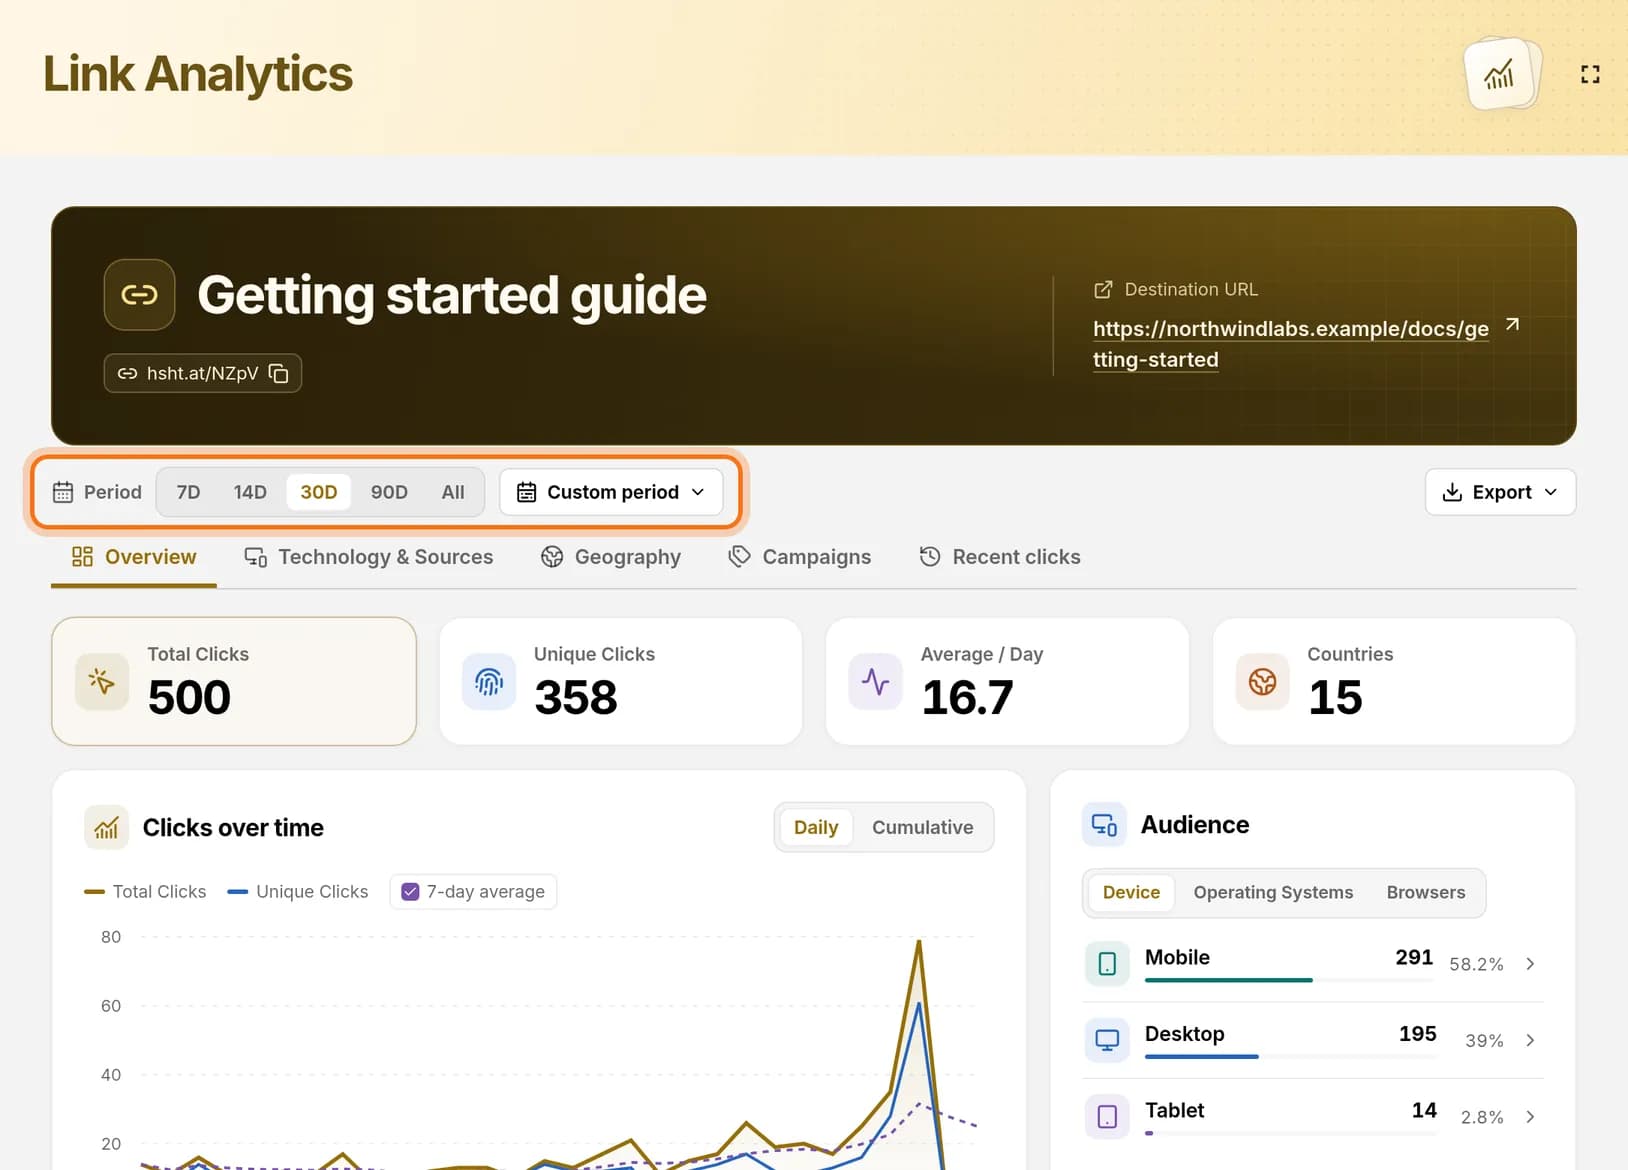
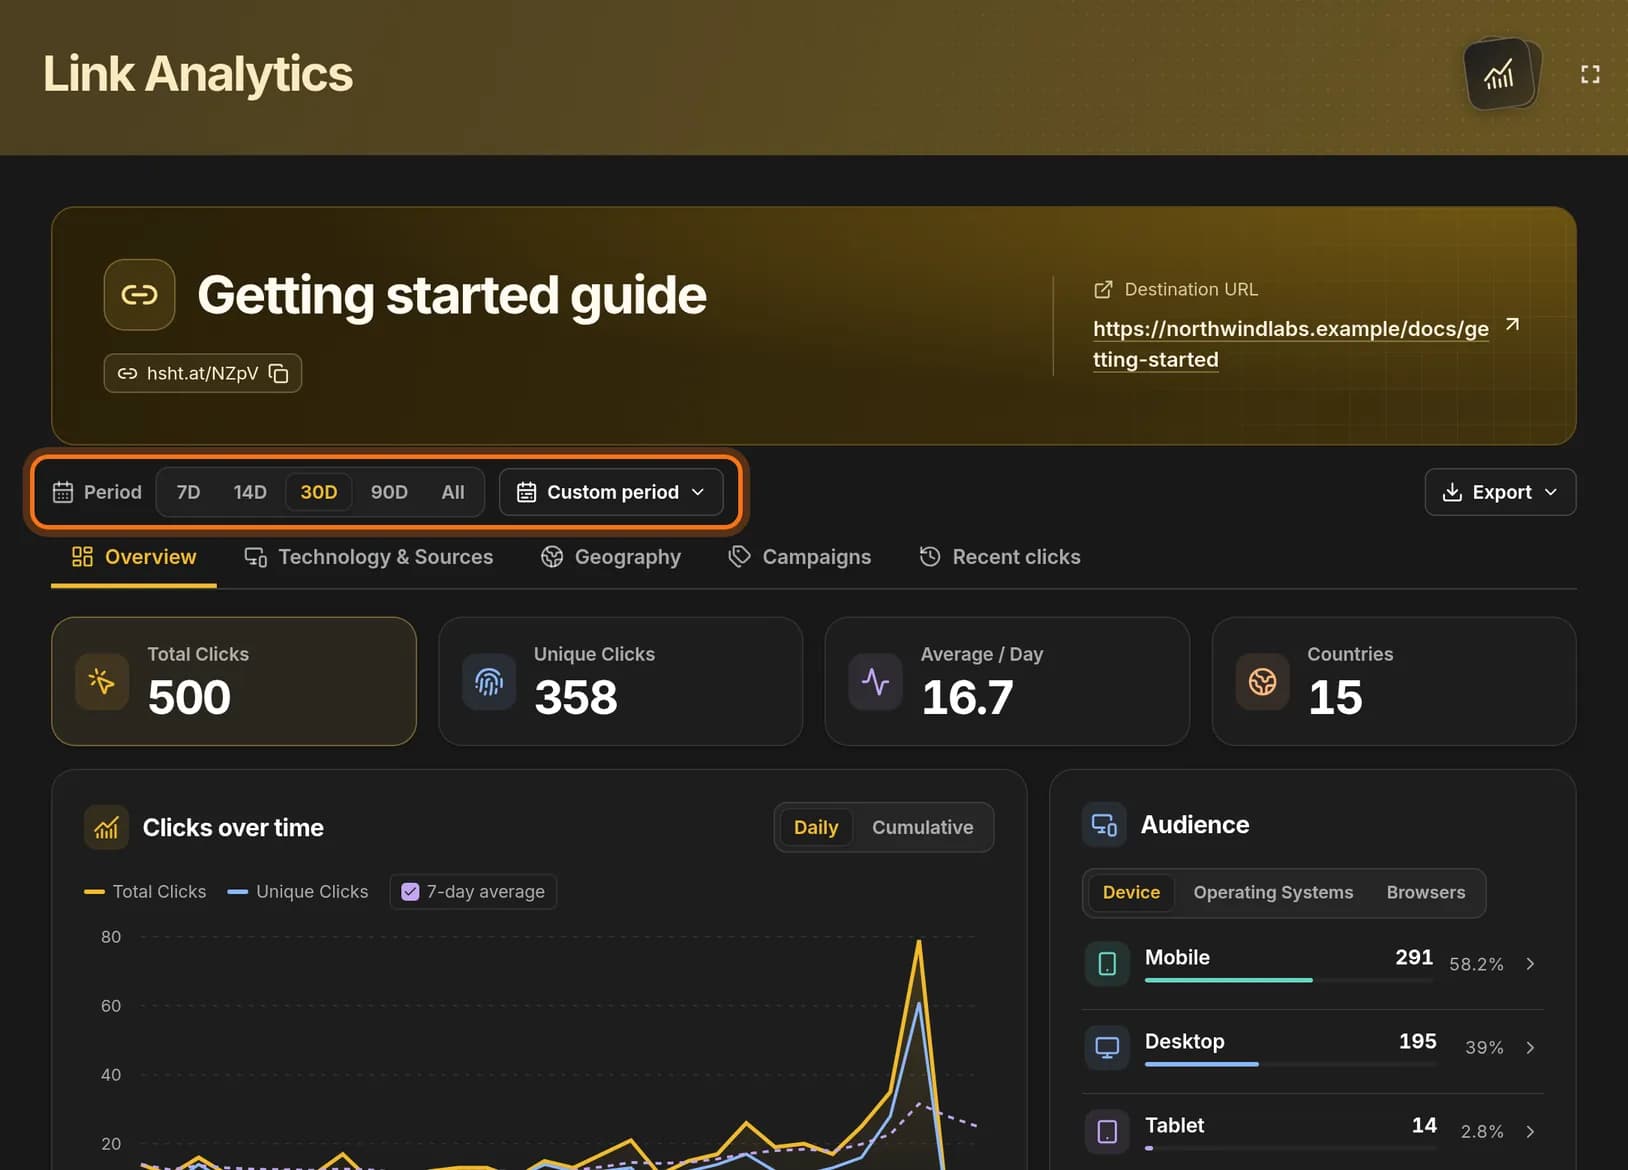
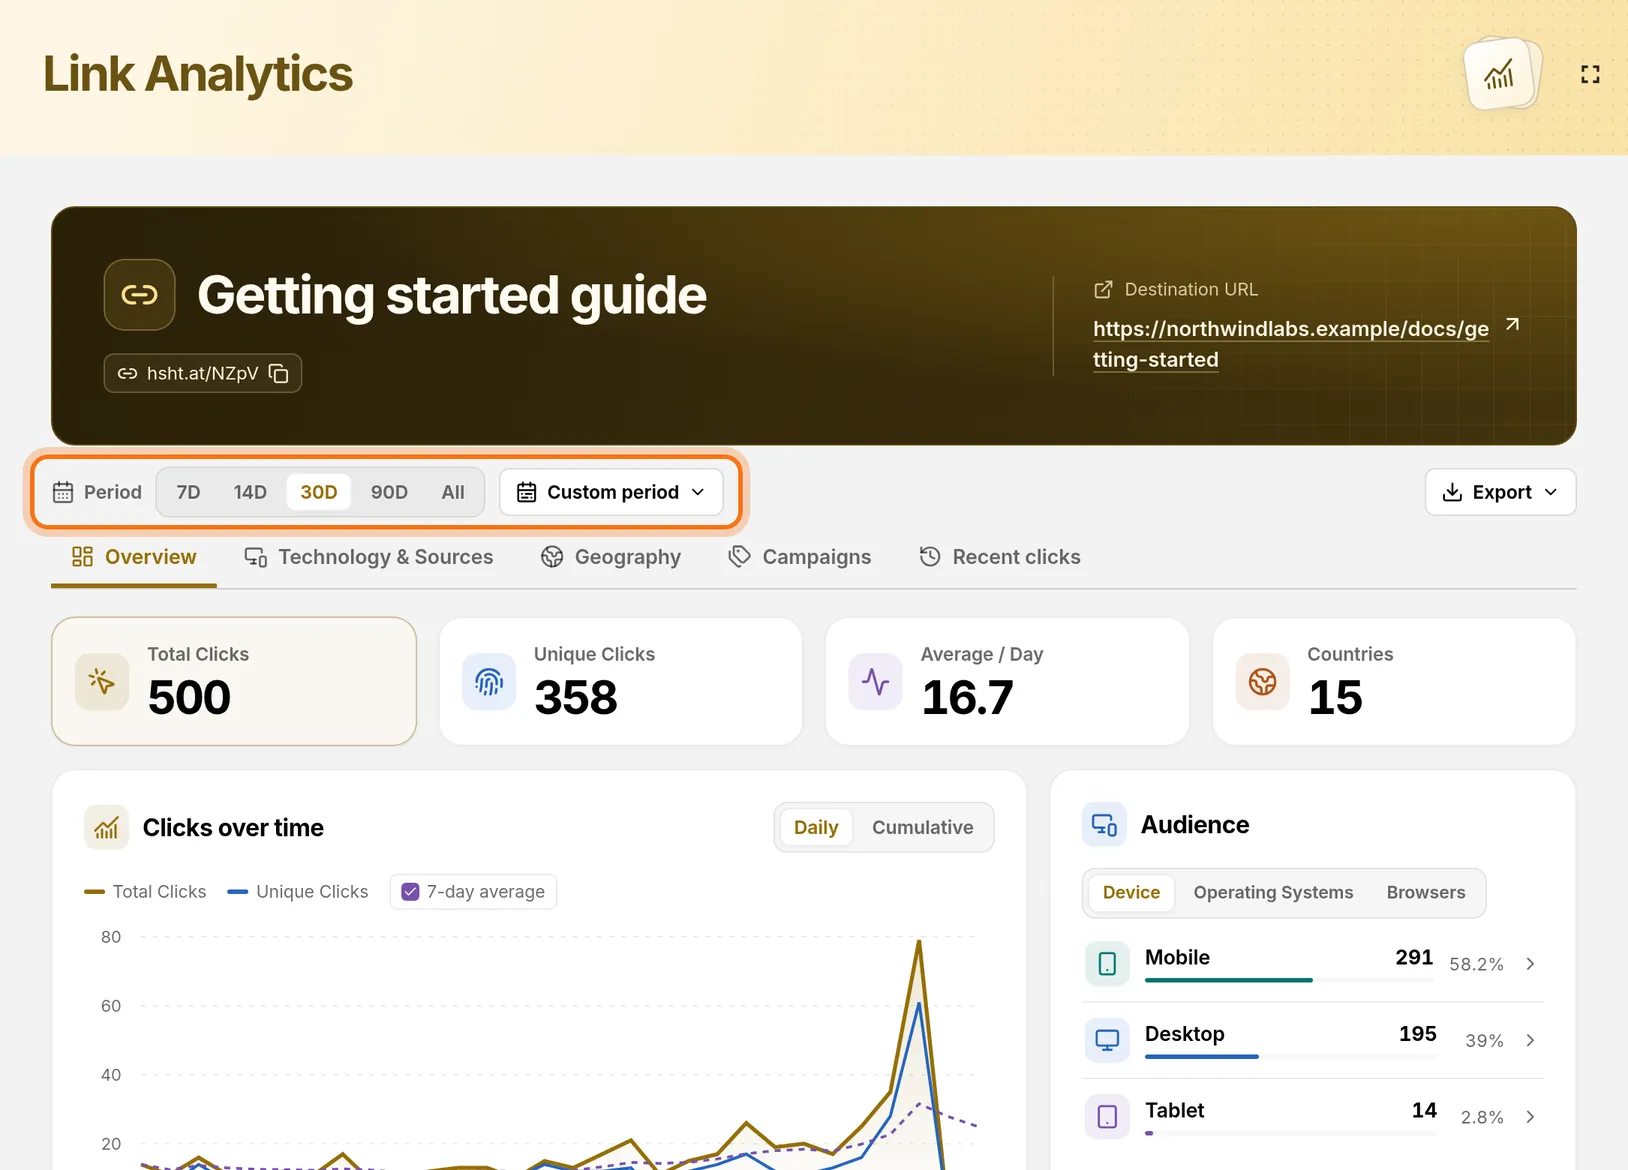
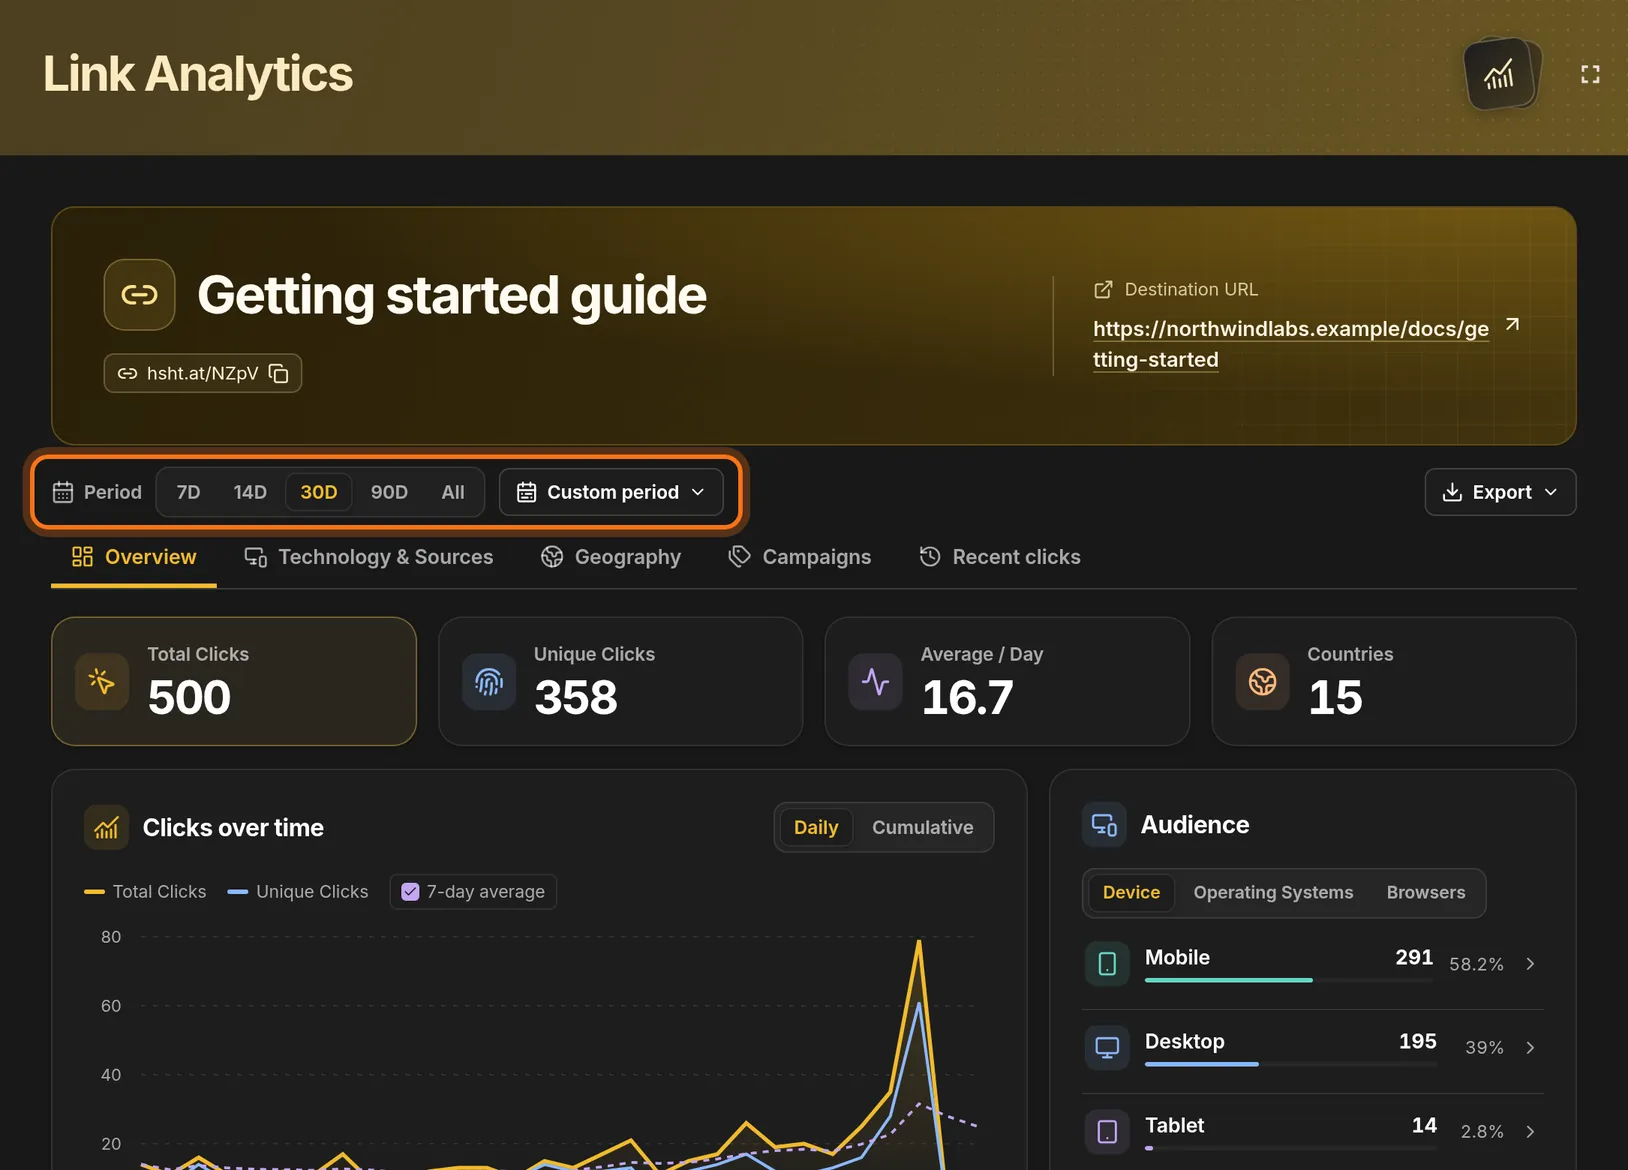
- Find Period under the banner.
- Click 7D for the last 7 days, 30D for the last 30 days, or All for everything.
You should see: All numbers and charts on the page change to that period.
 Full size
 Full size
The selected period is the one in bold. Here it is 30D. Step 3: Or enter your own dates
- Skip this step if one of the buttons fits.
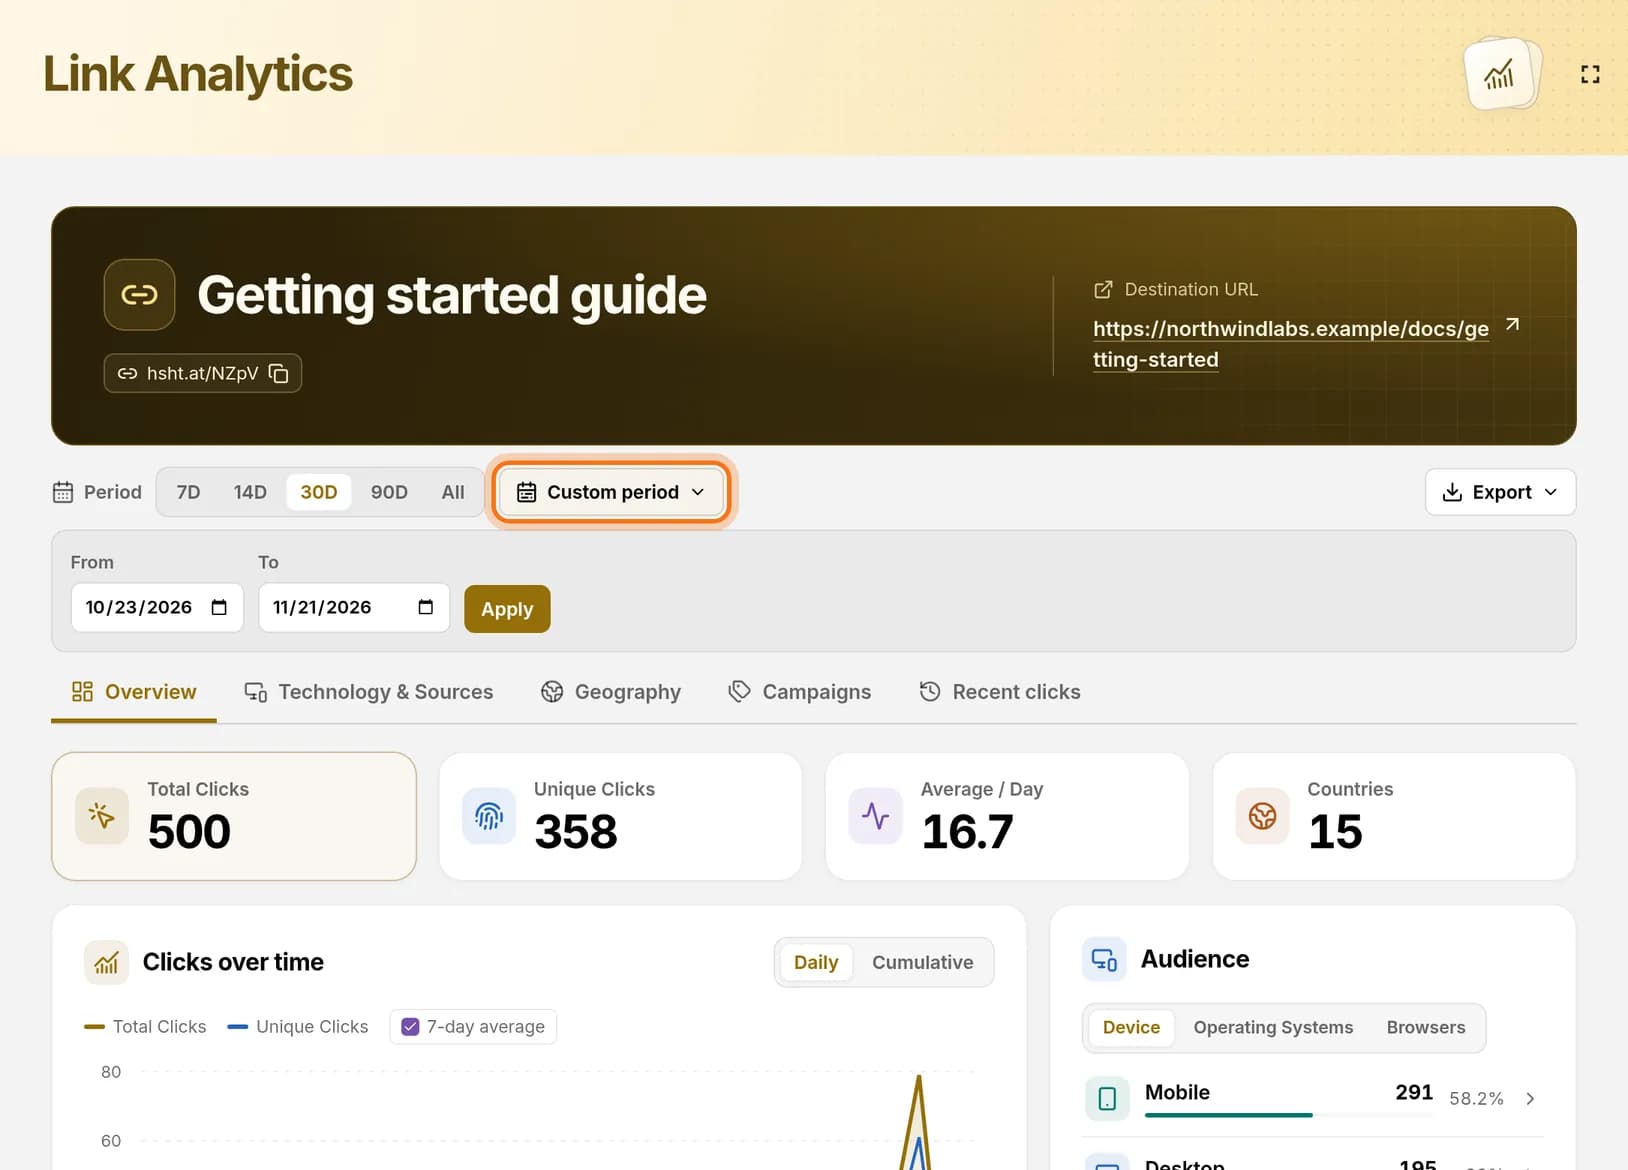
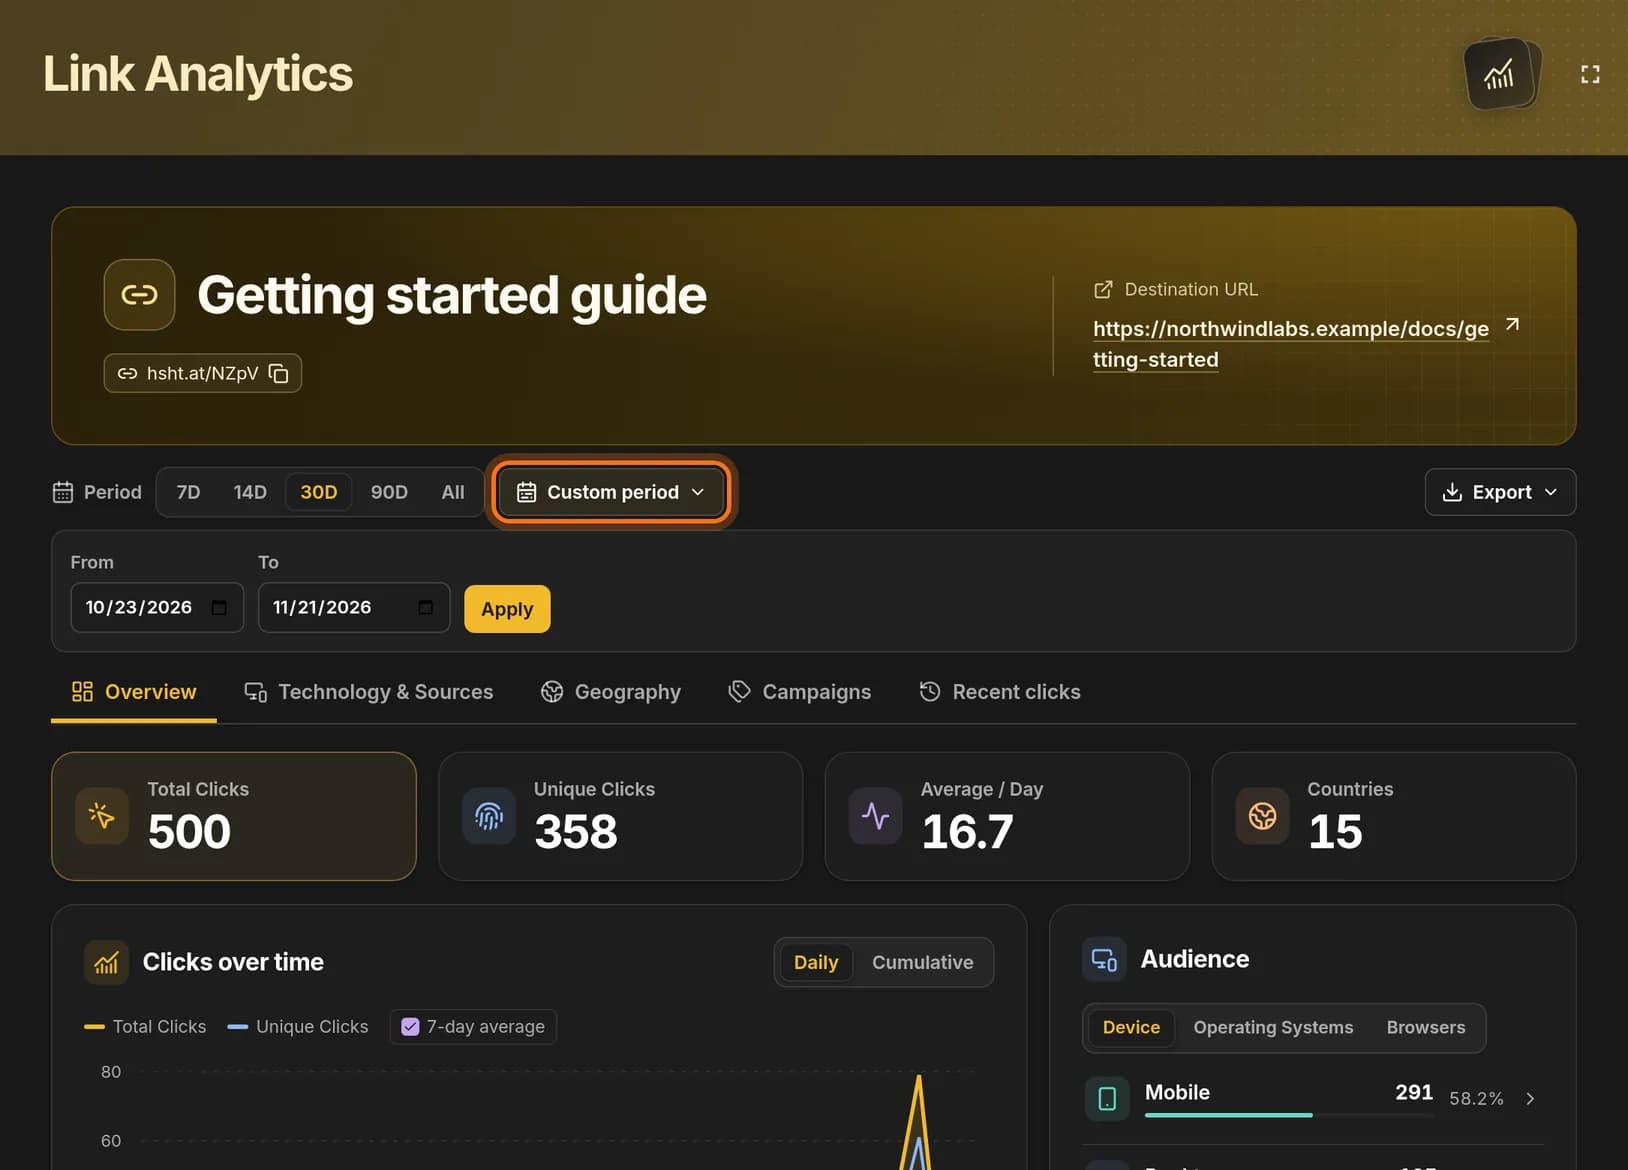
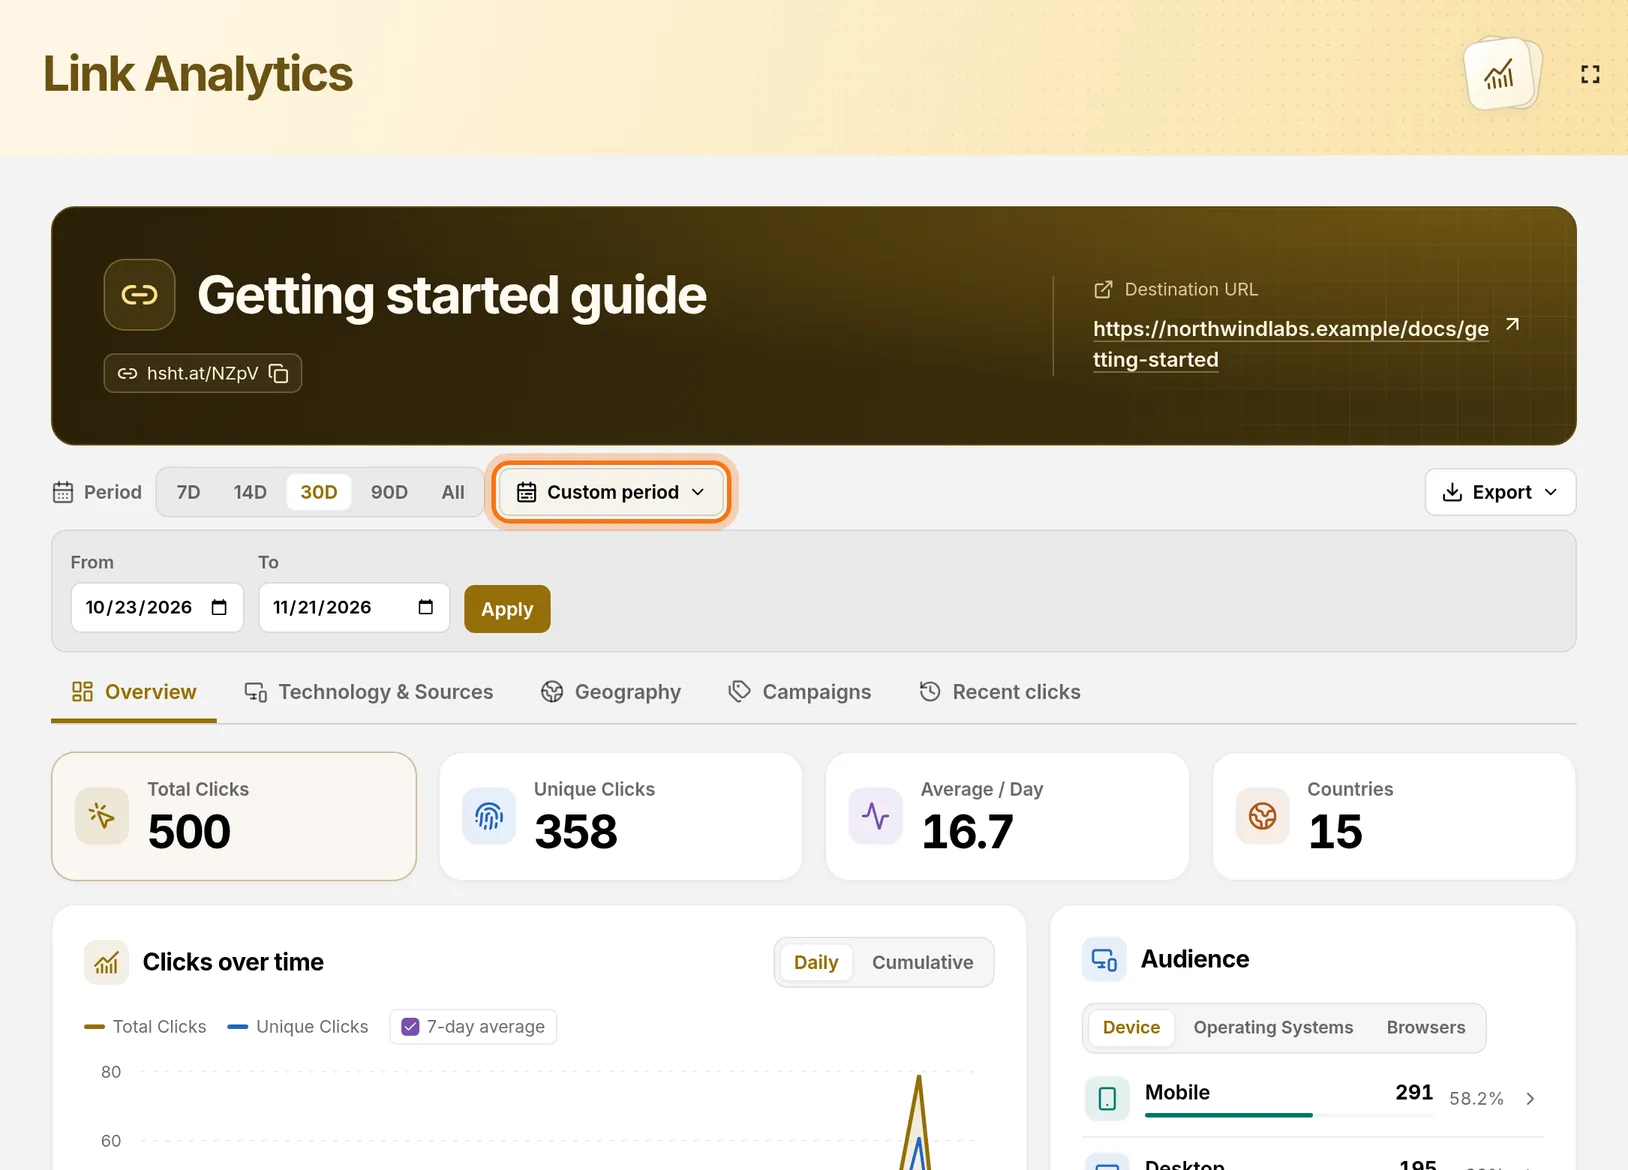
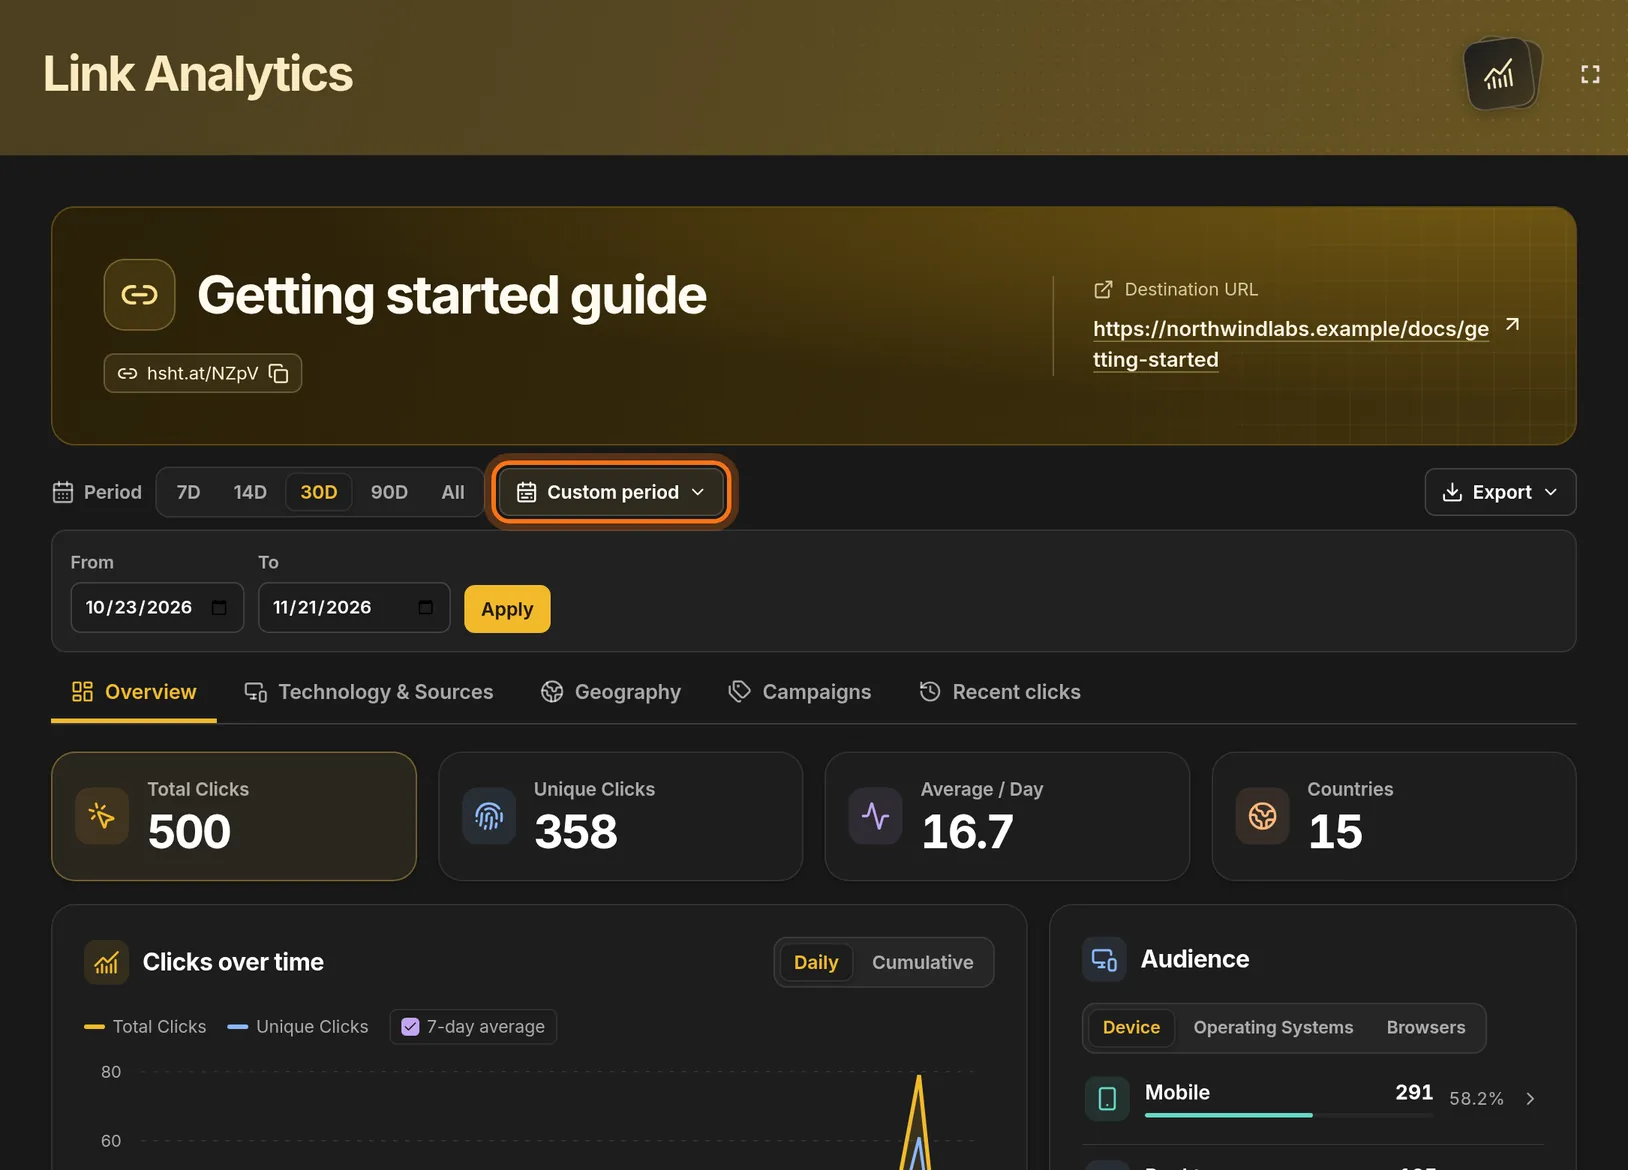
- Click Custom period.
- Enter the first day in From and the last day in To.
- Click Apply.
 Full size
 Full size
Use Custom period for a campaign with fixed start and end dates. Step 4: Read the two main numbers
- Stay on the Overview tab.
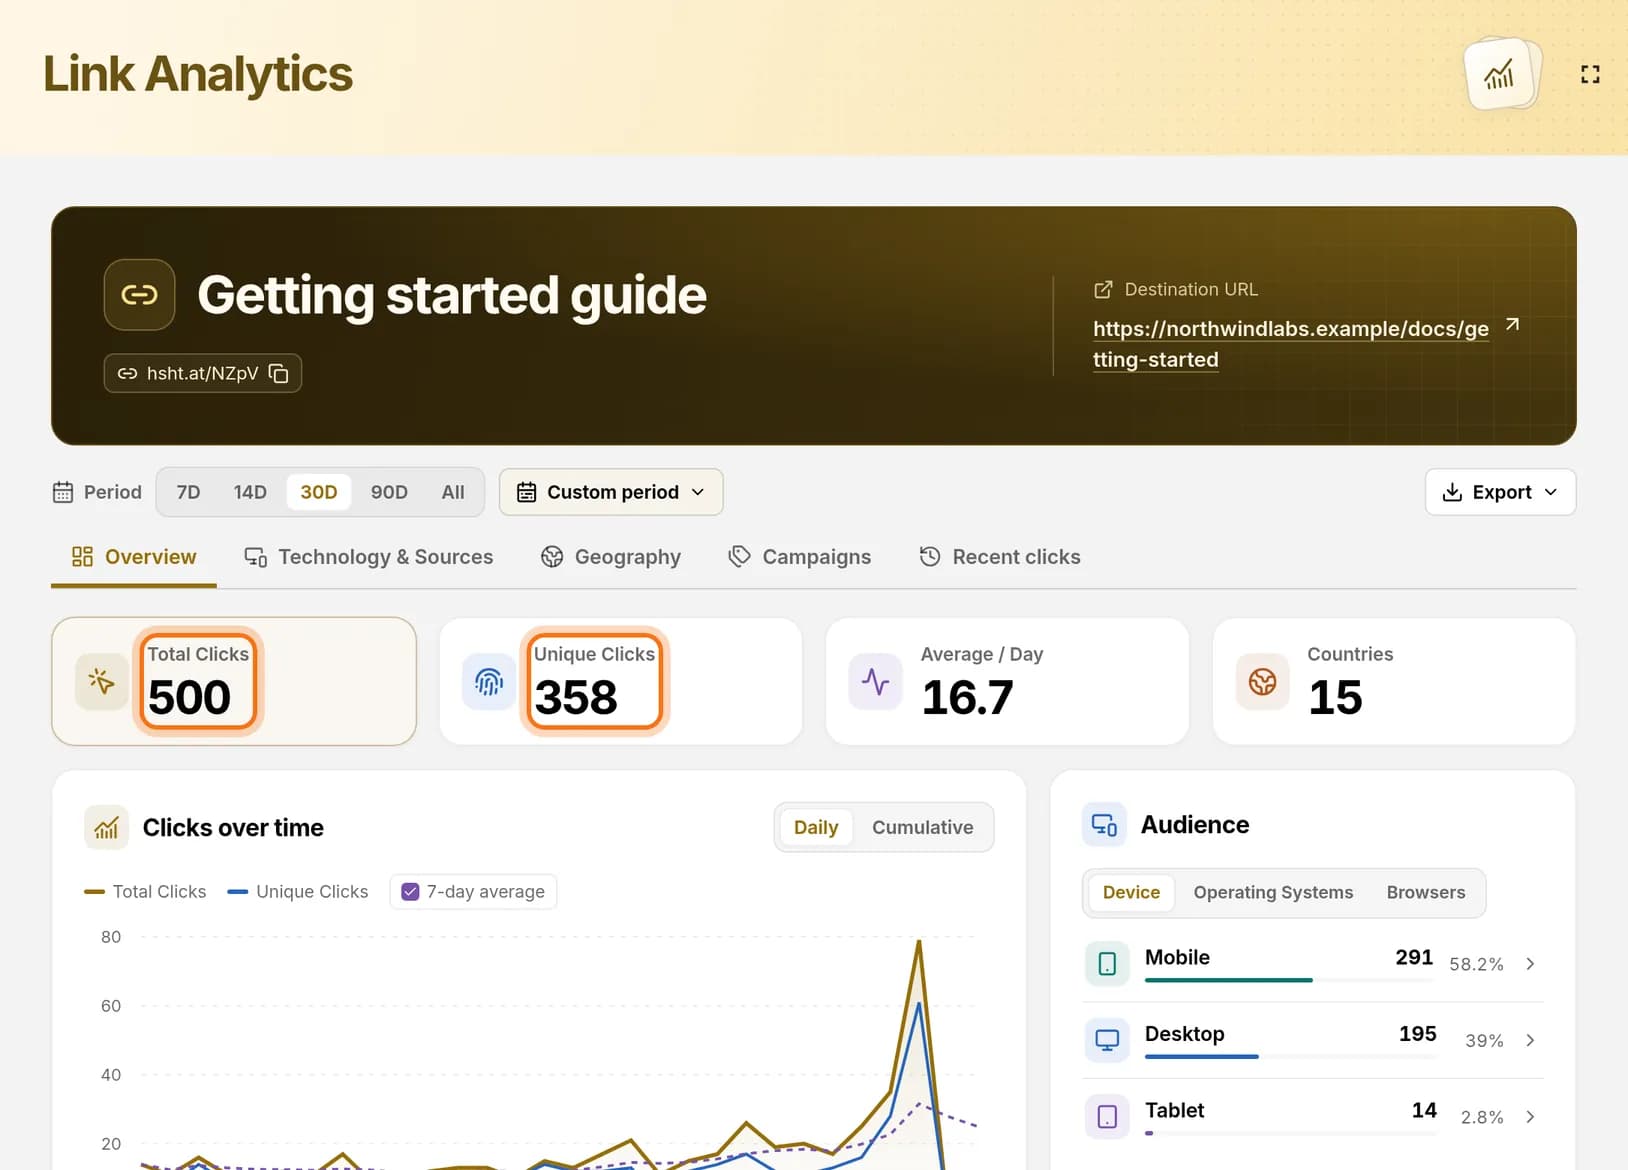
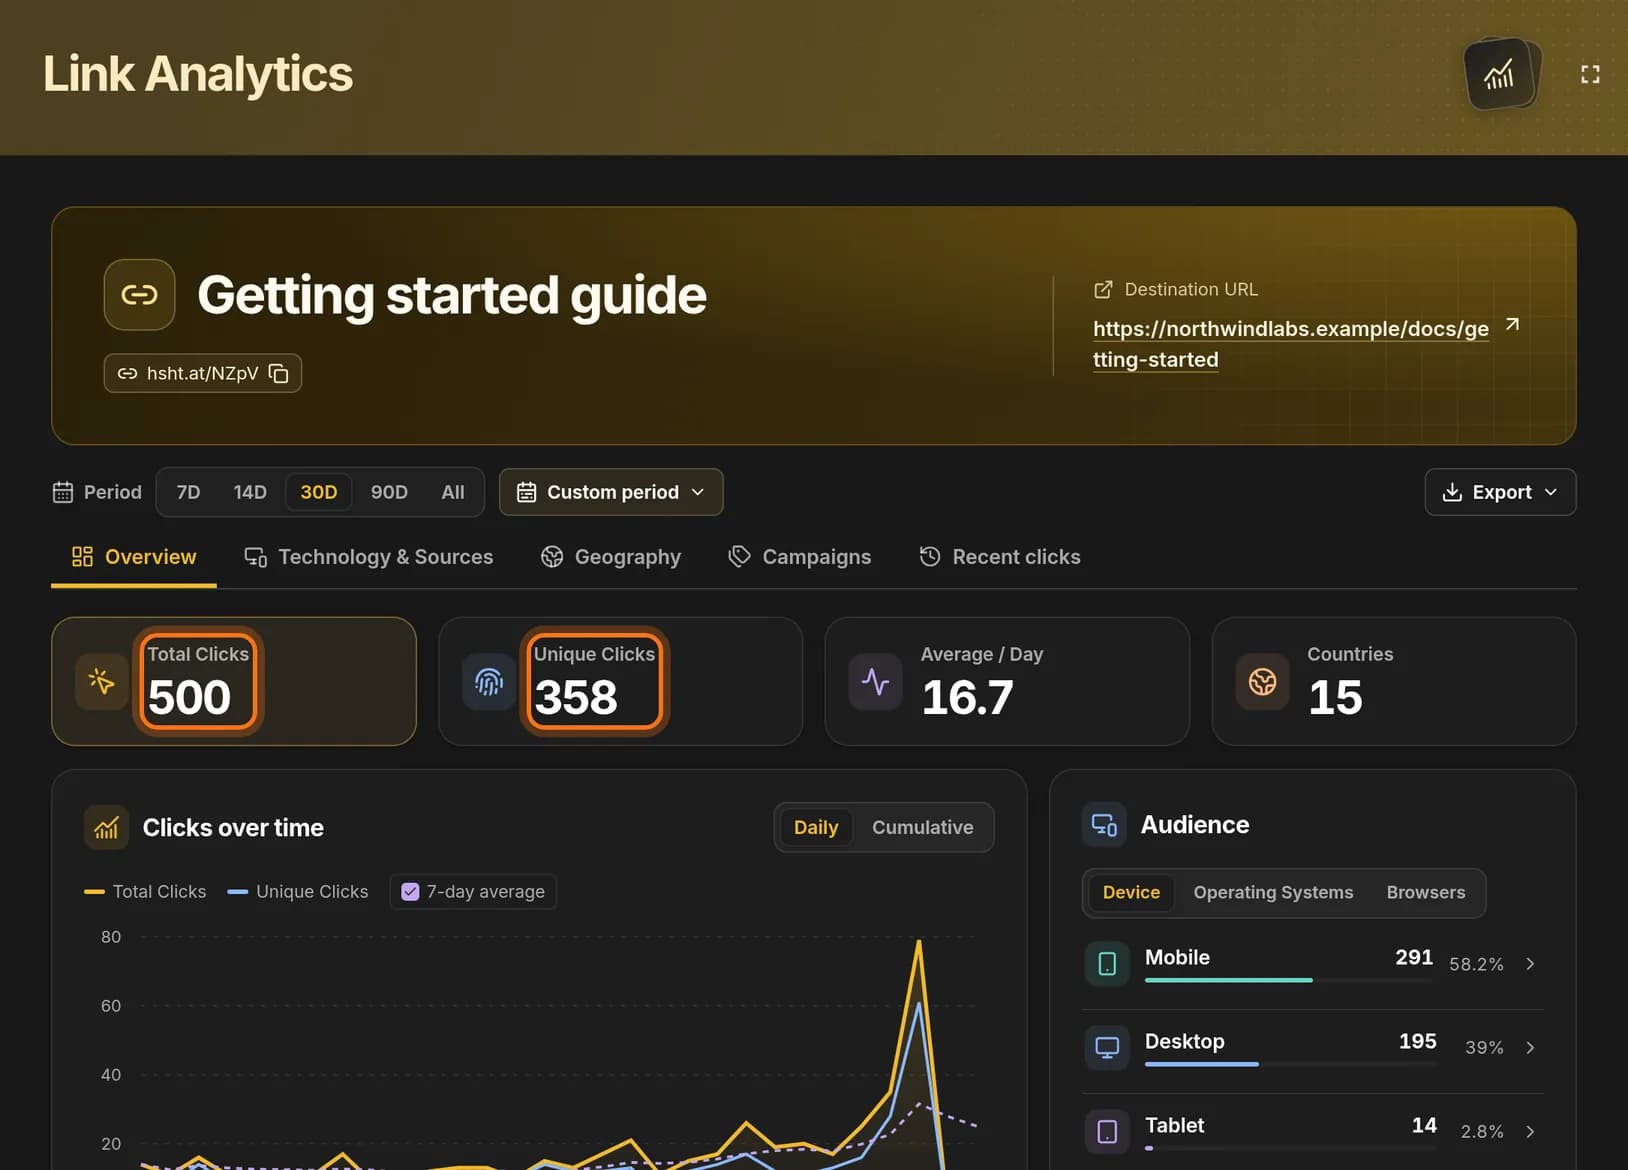
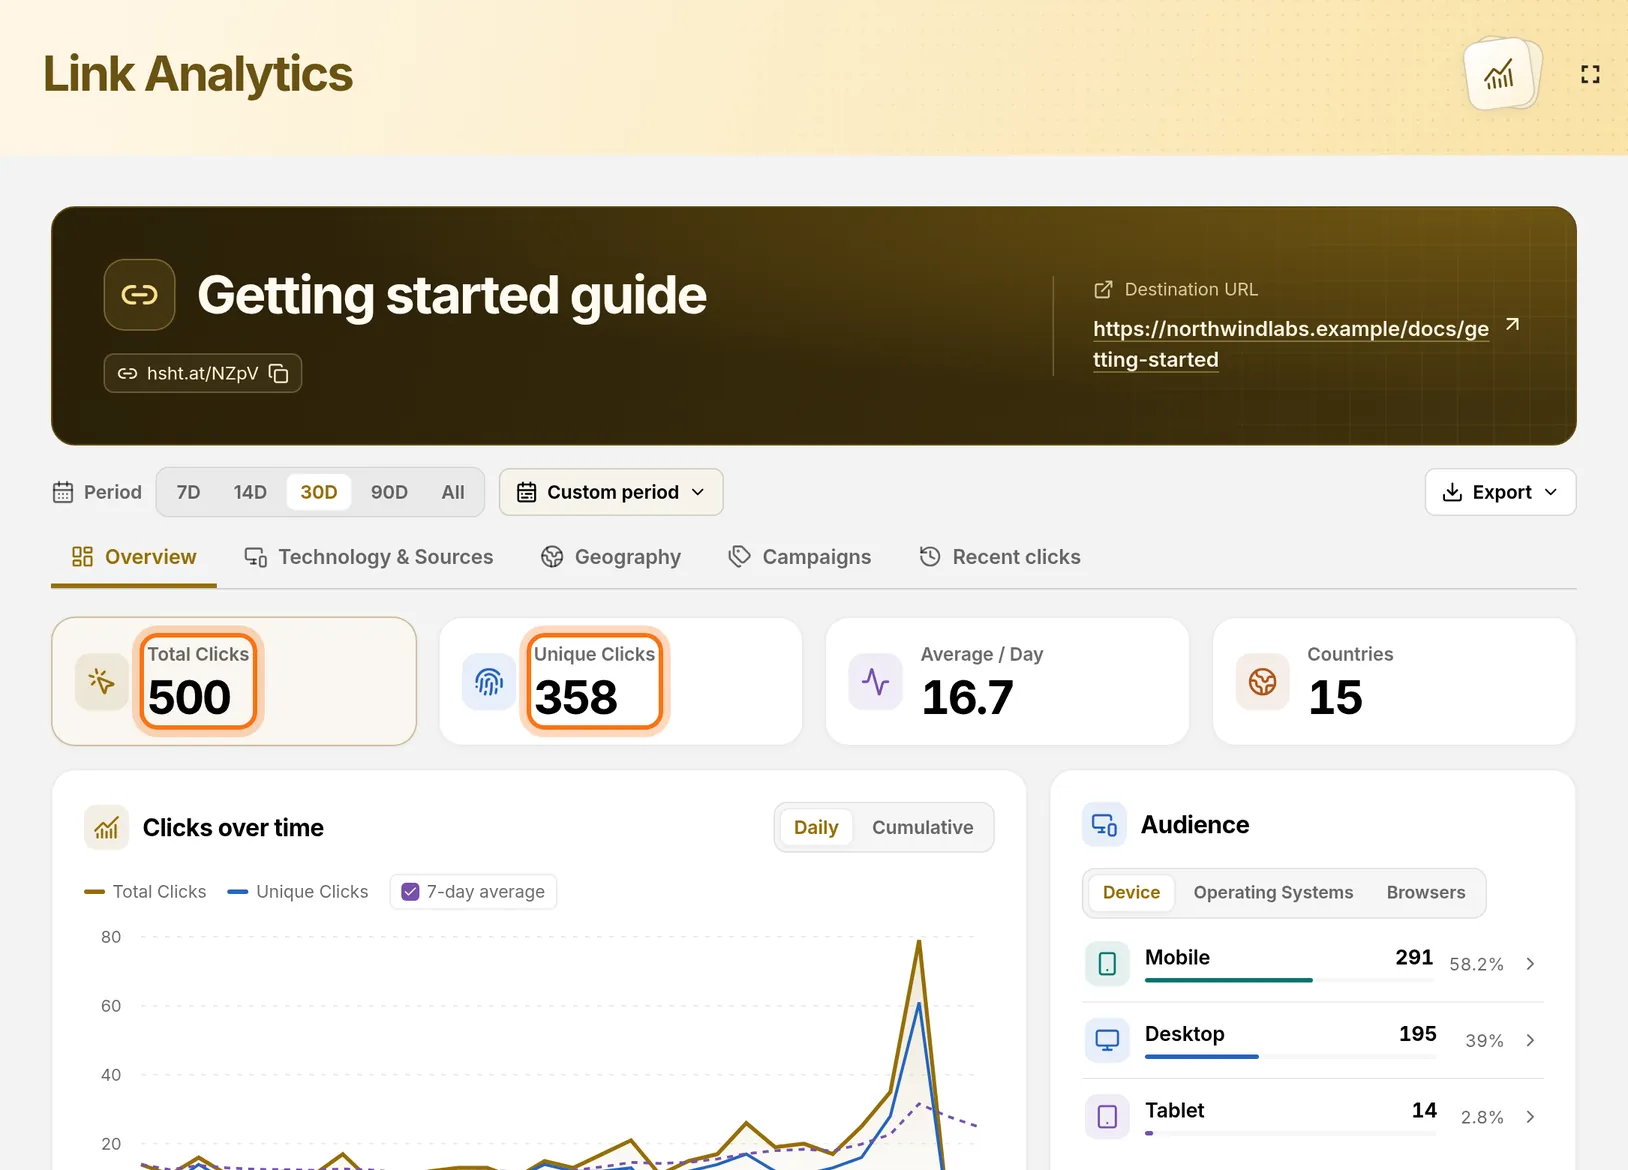
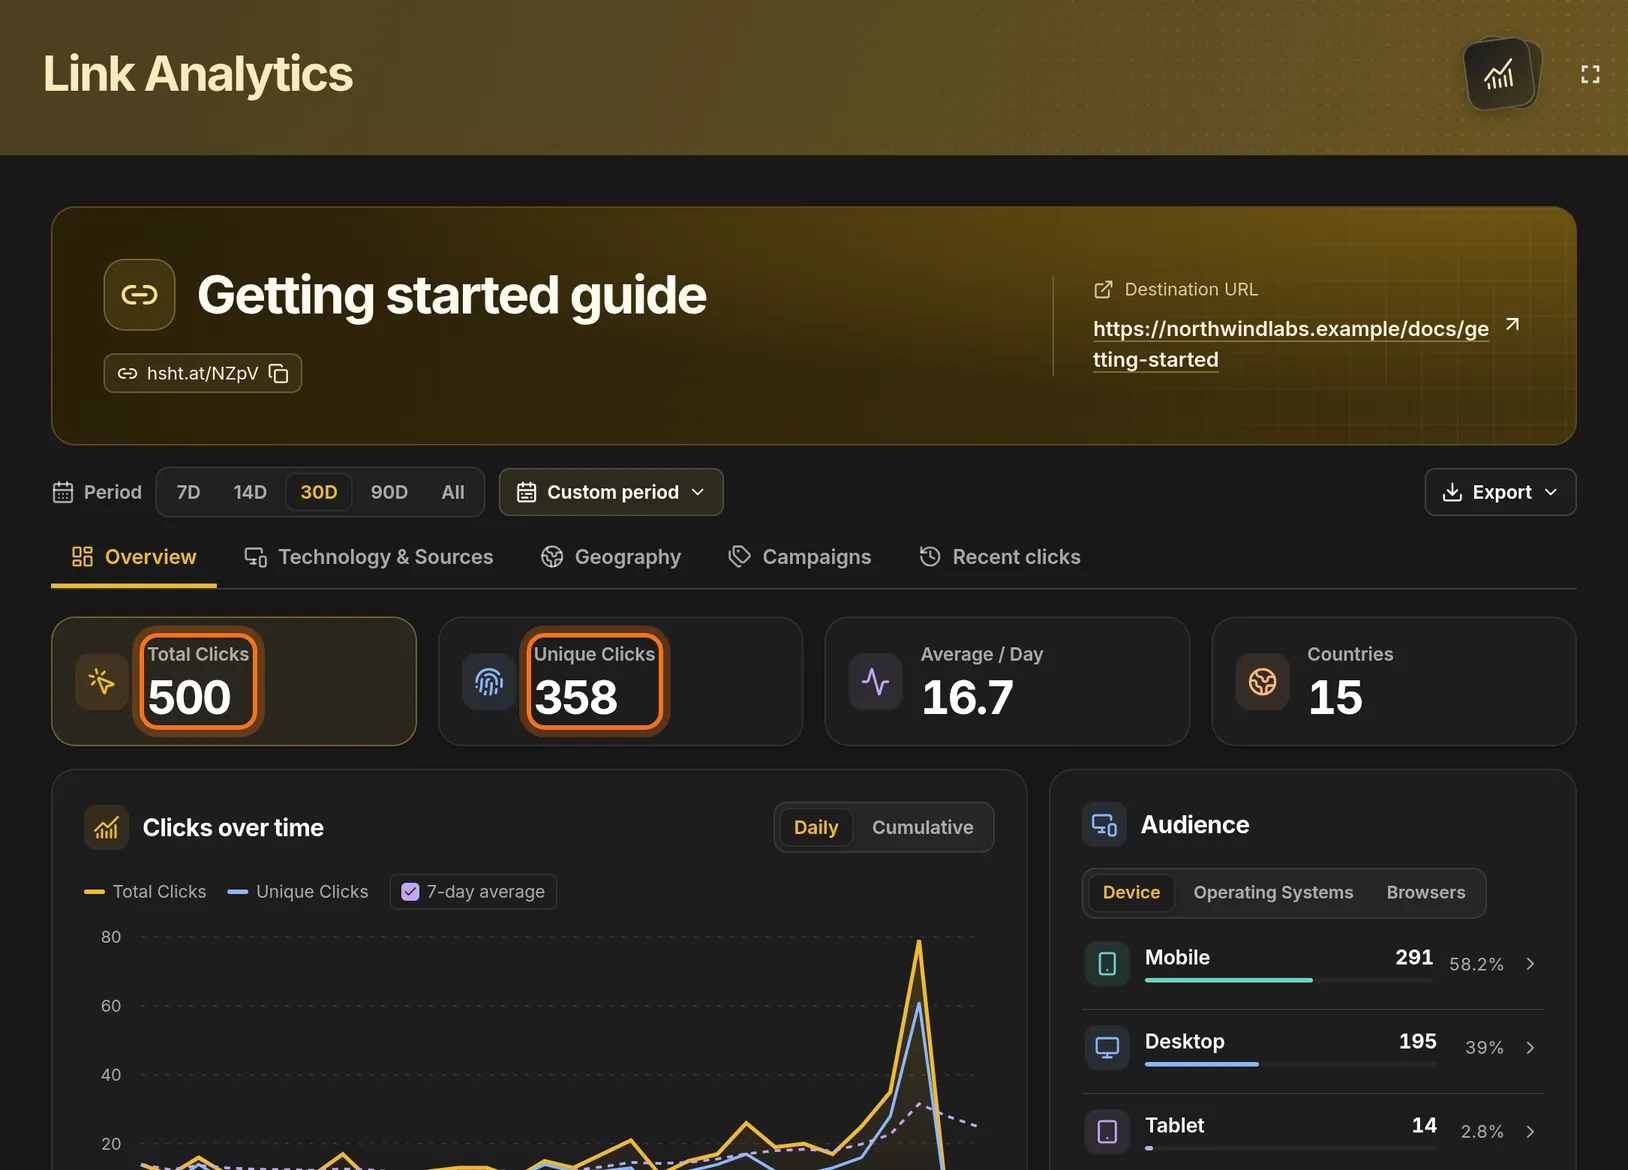
- Total Clicks counts every click, including repeat visits by the same person.
- Unique Clicks estimates how many different people clicked.
 Full size
 Full size
In this example, 358 people made 500 clicks in 30 days. Use Total Clicks to talk about traffic and Unique Clicks to talk about how many people you reached.
Step 5: Find the busiest day
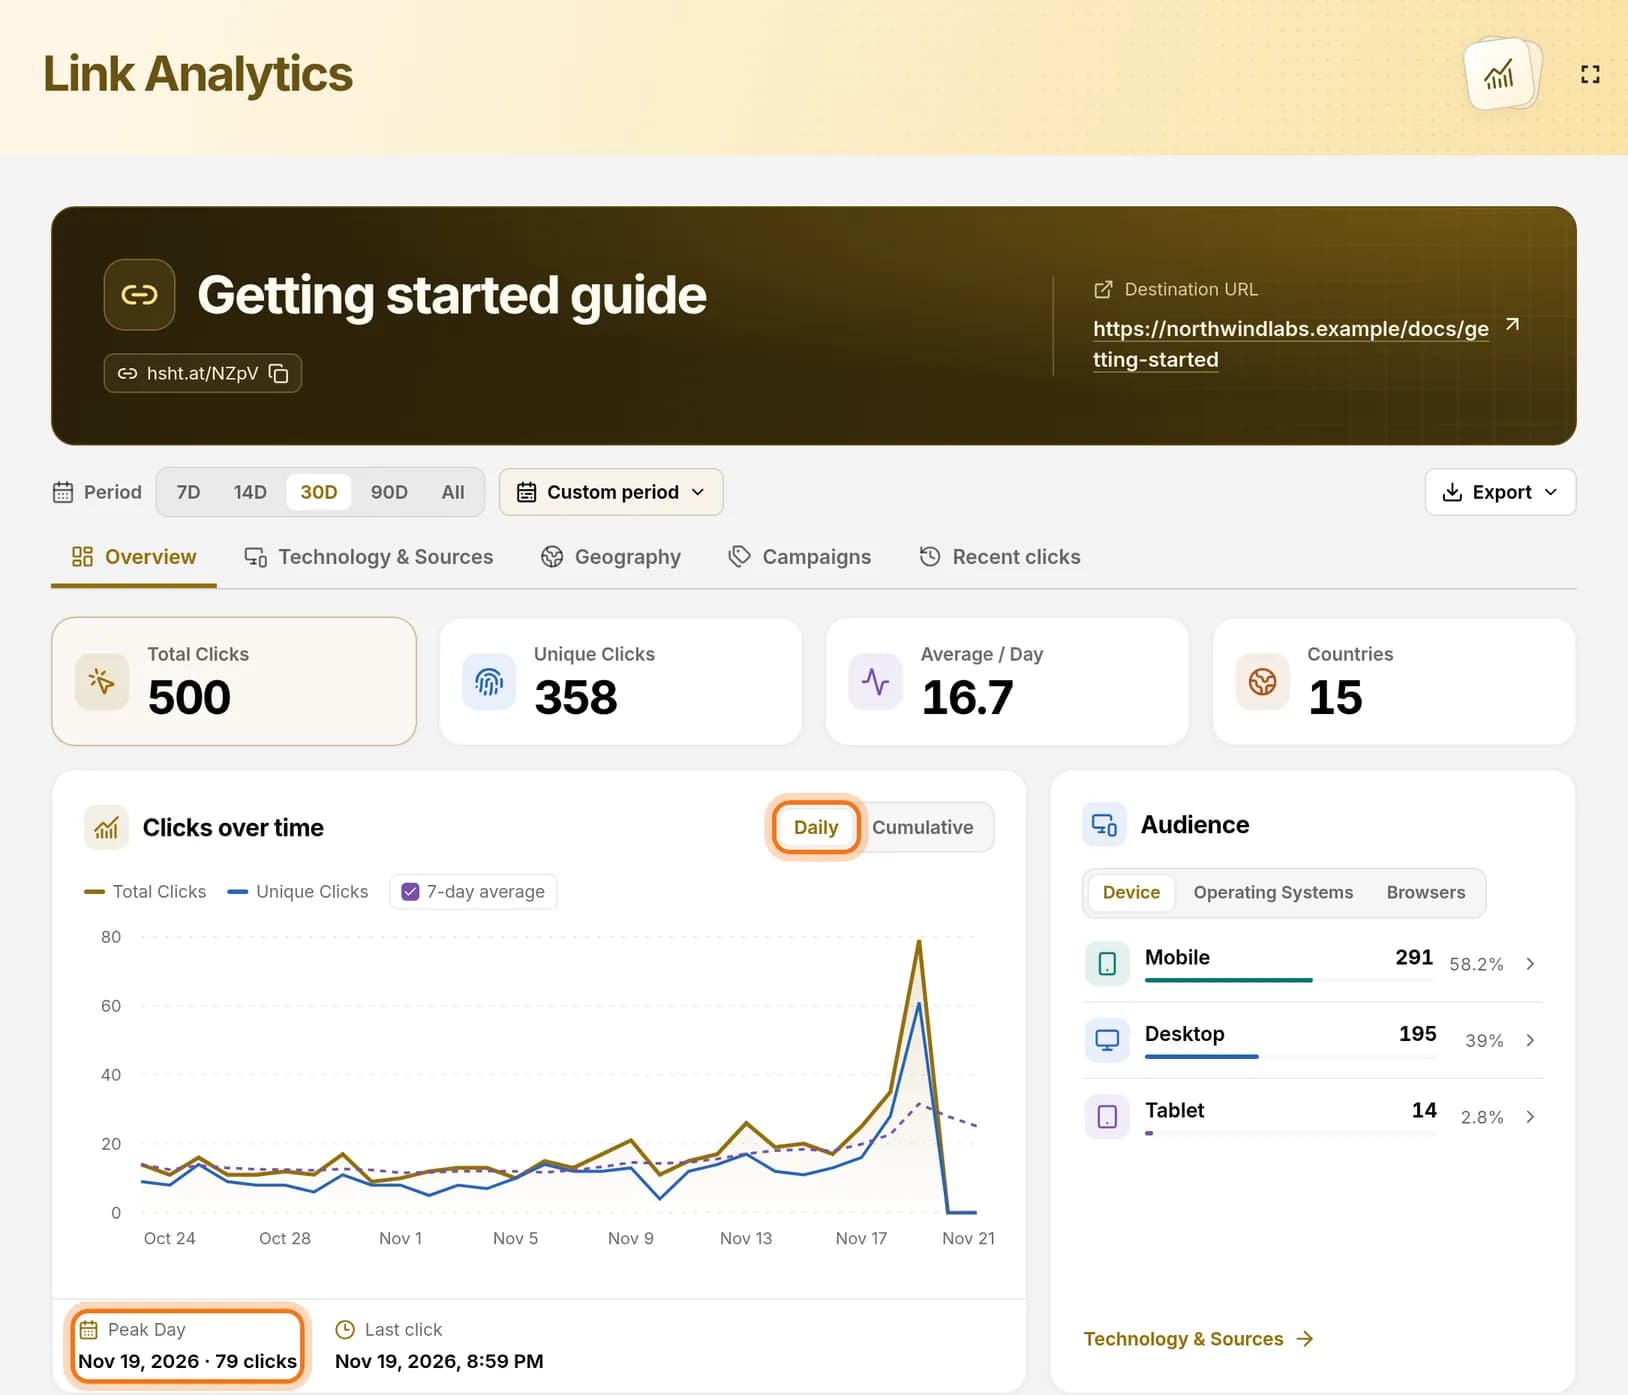
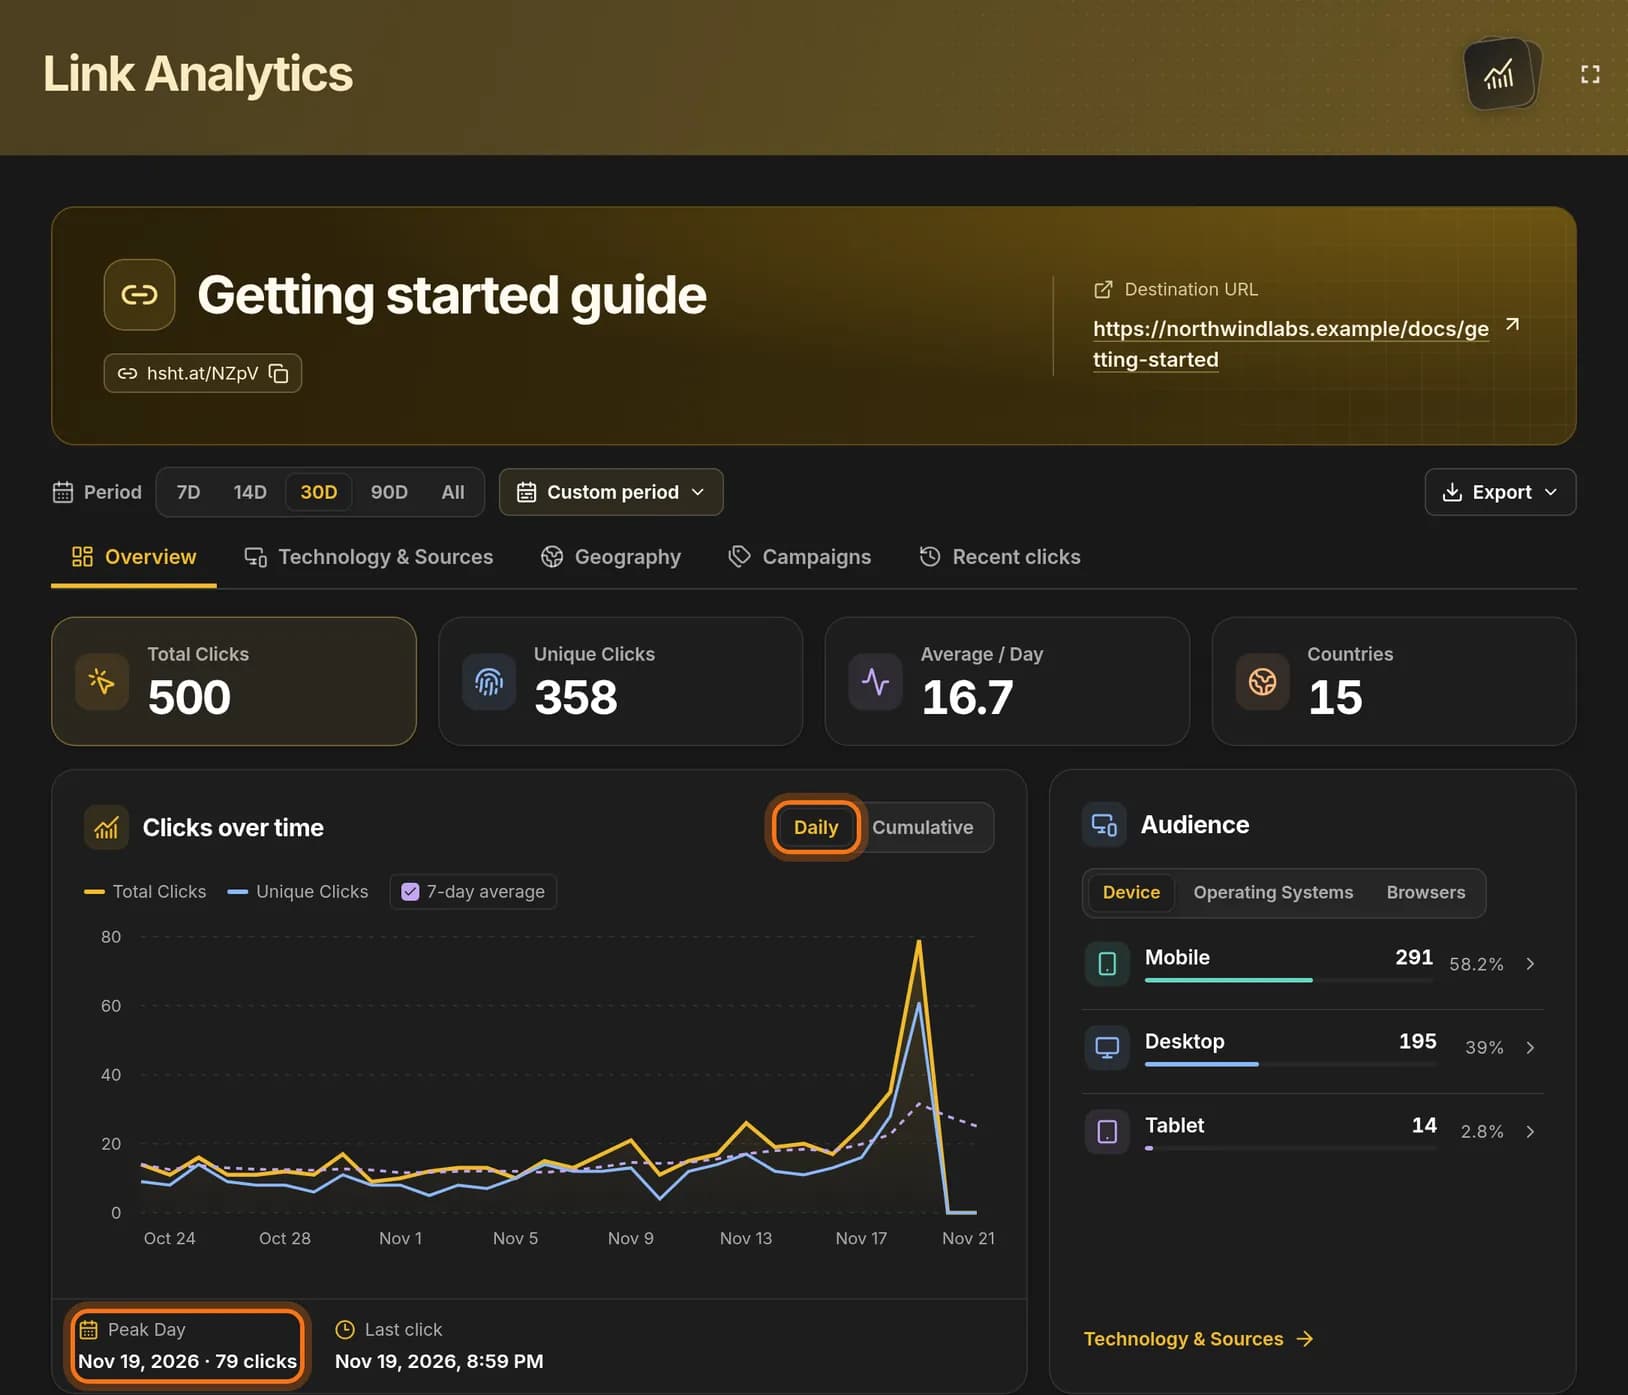
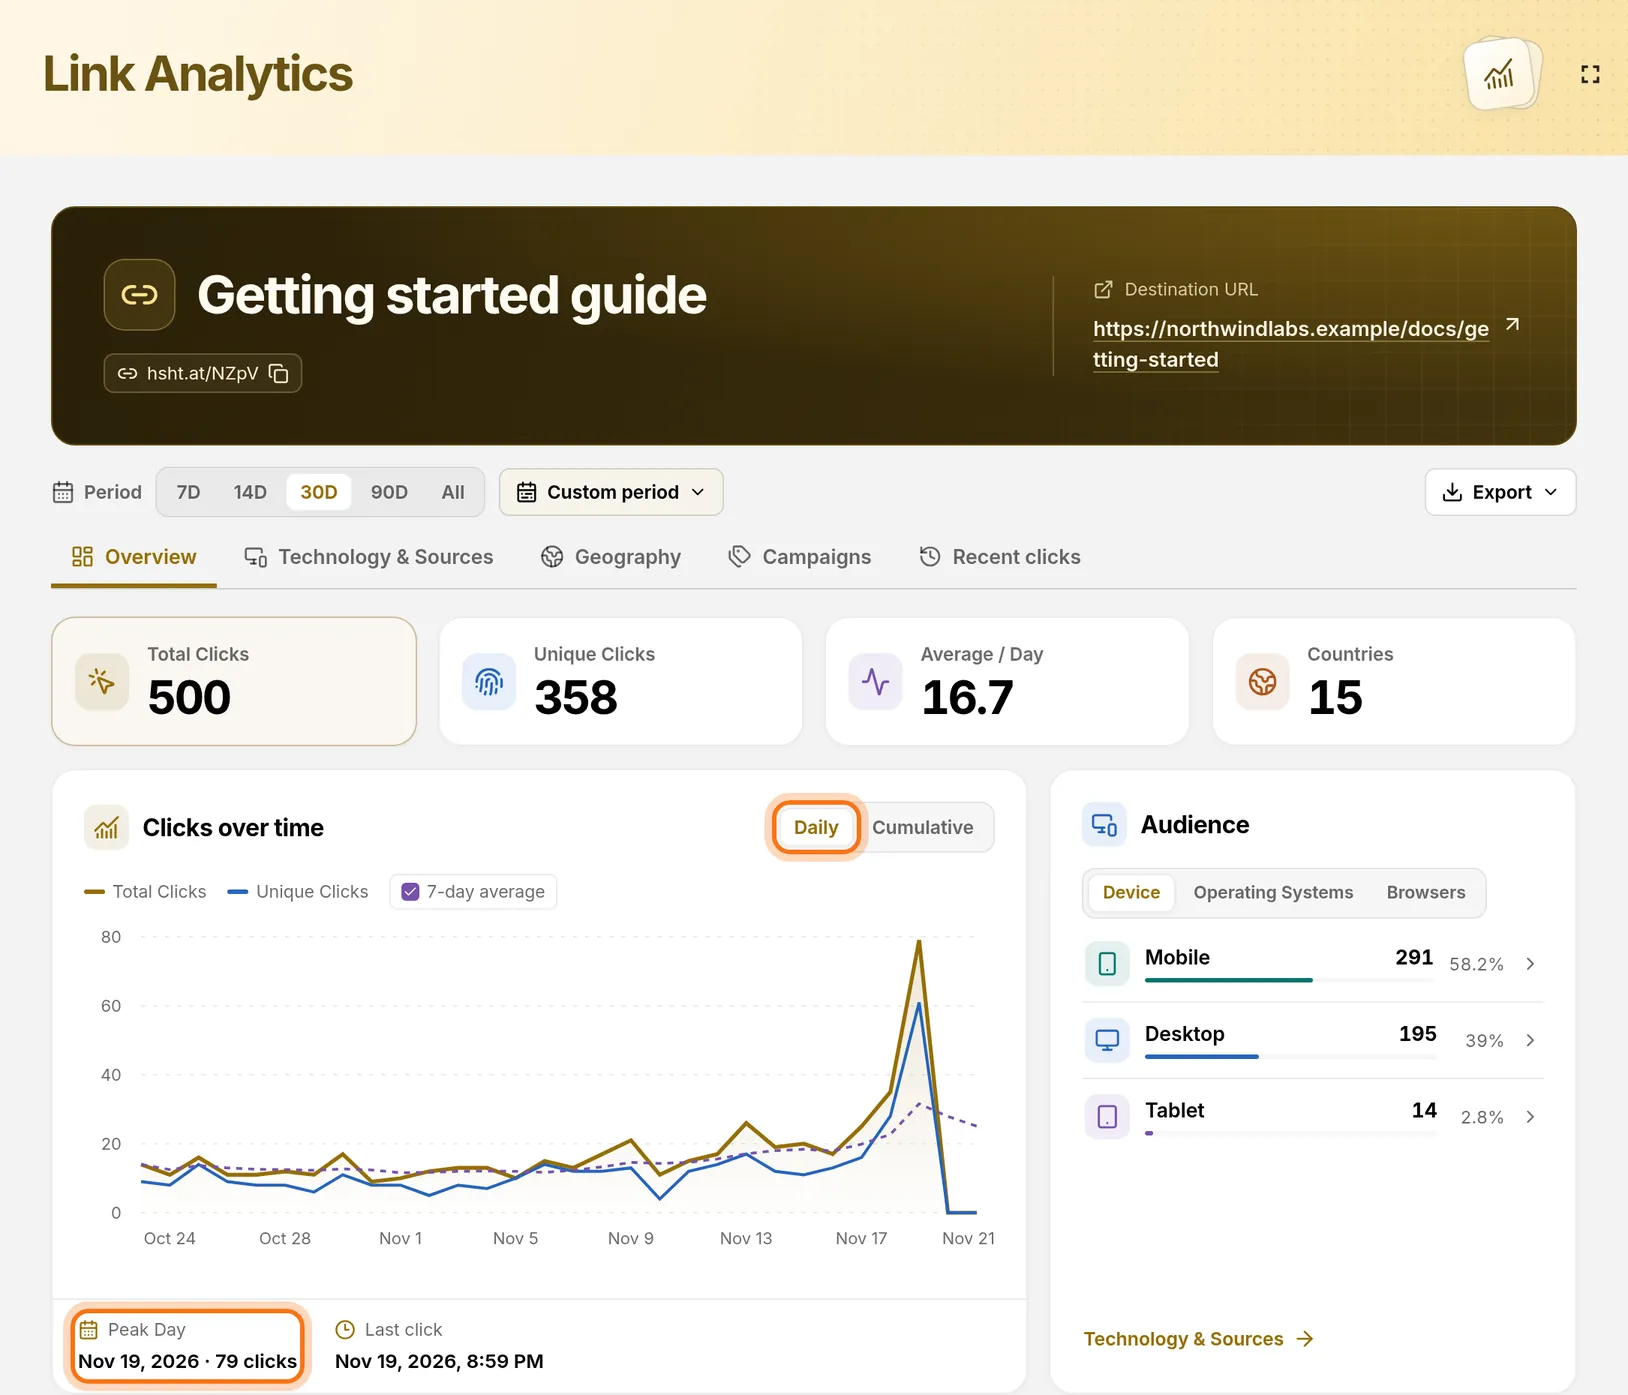
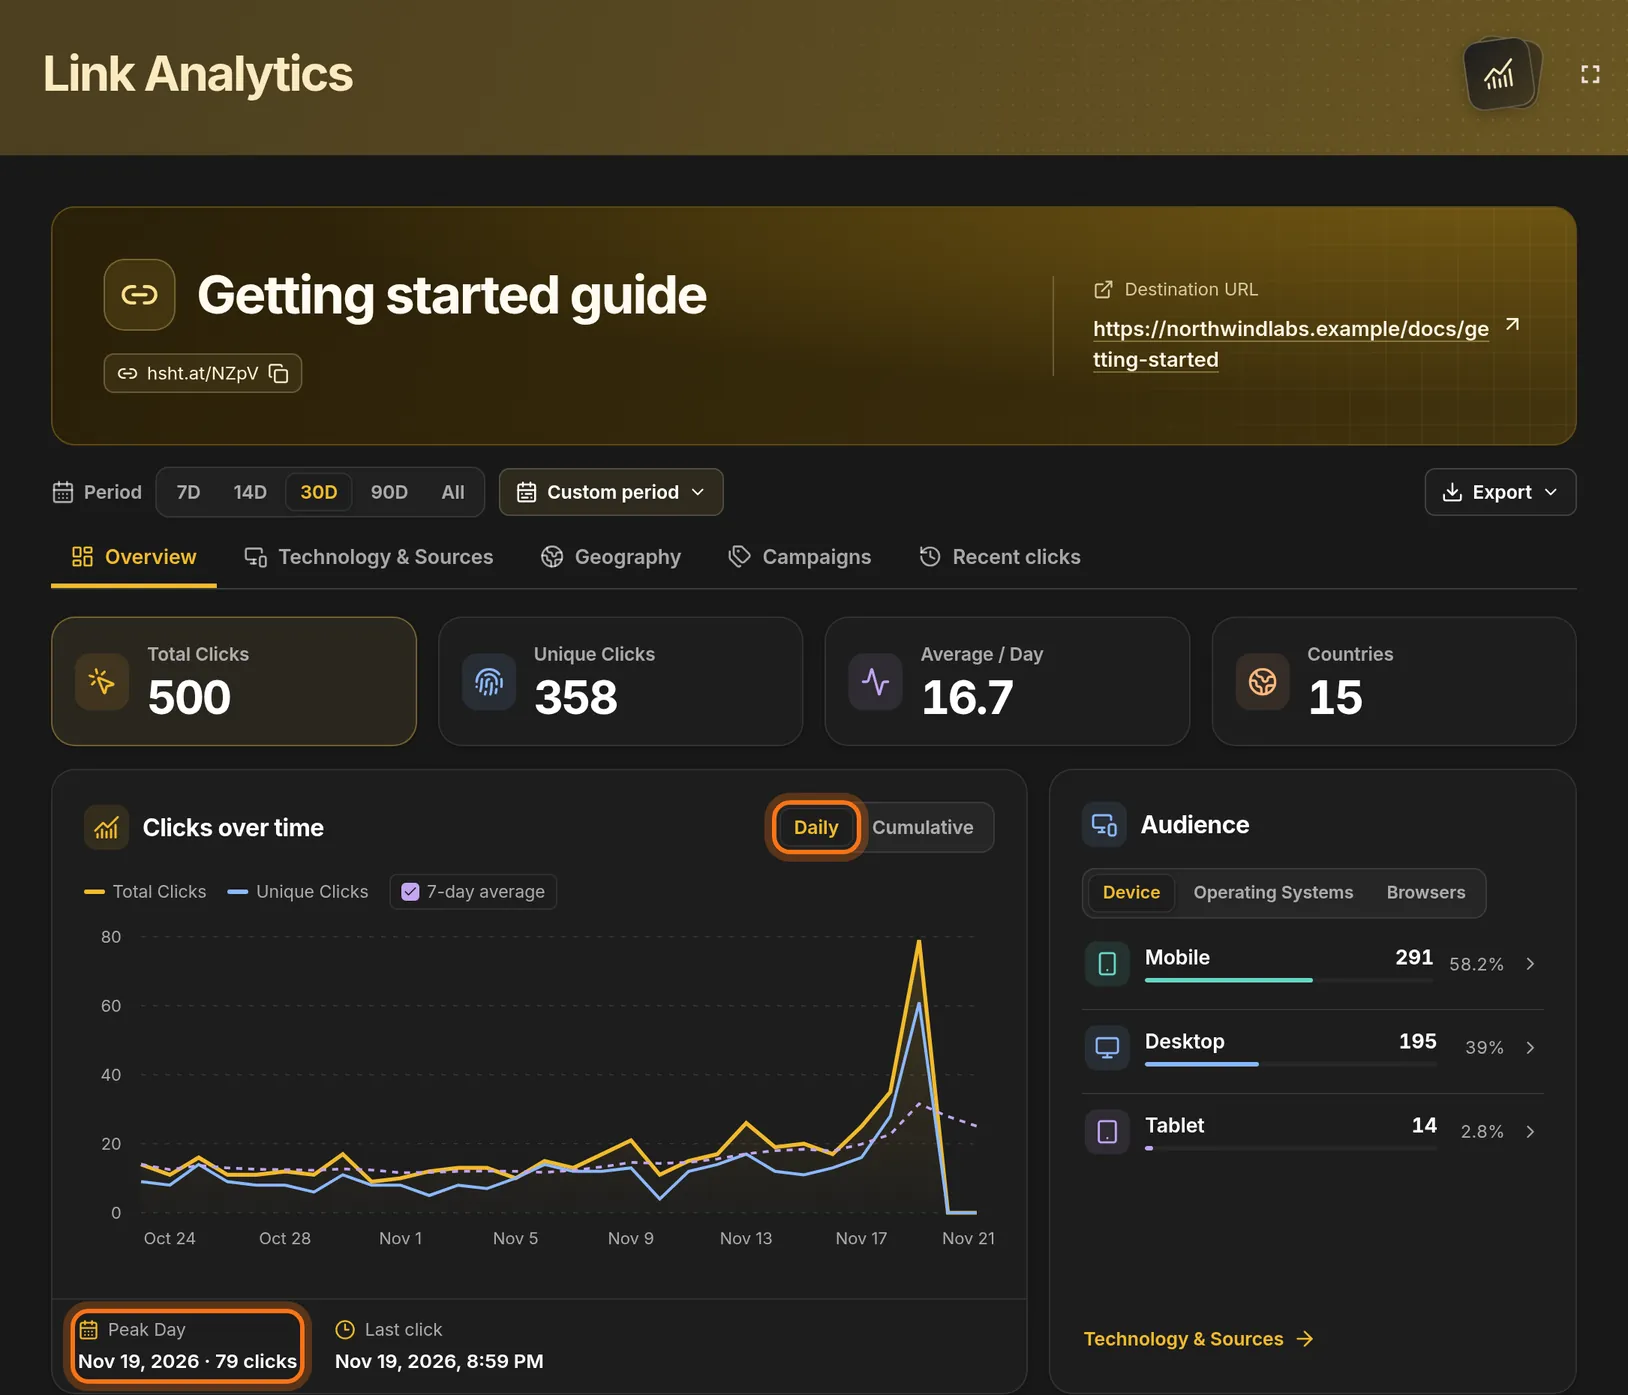
- Look at the chart Clicks over time.
- Make sure Daily is selected at the top right of the chart.
- Read Peak Day under the chart. It gives the date and the number of clicks.
 Full size
 Full size
Peak Day names the busiest day, so you do not have to read it off the chart. Step 6: Download the numbers
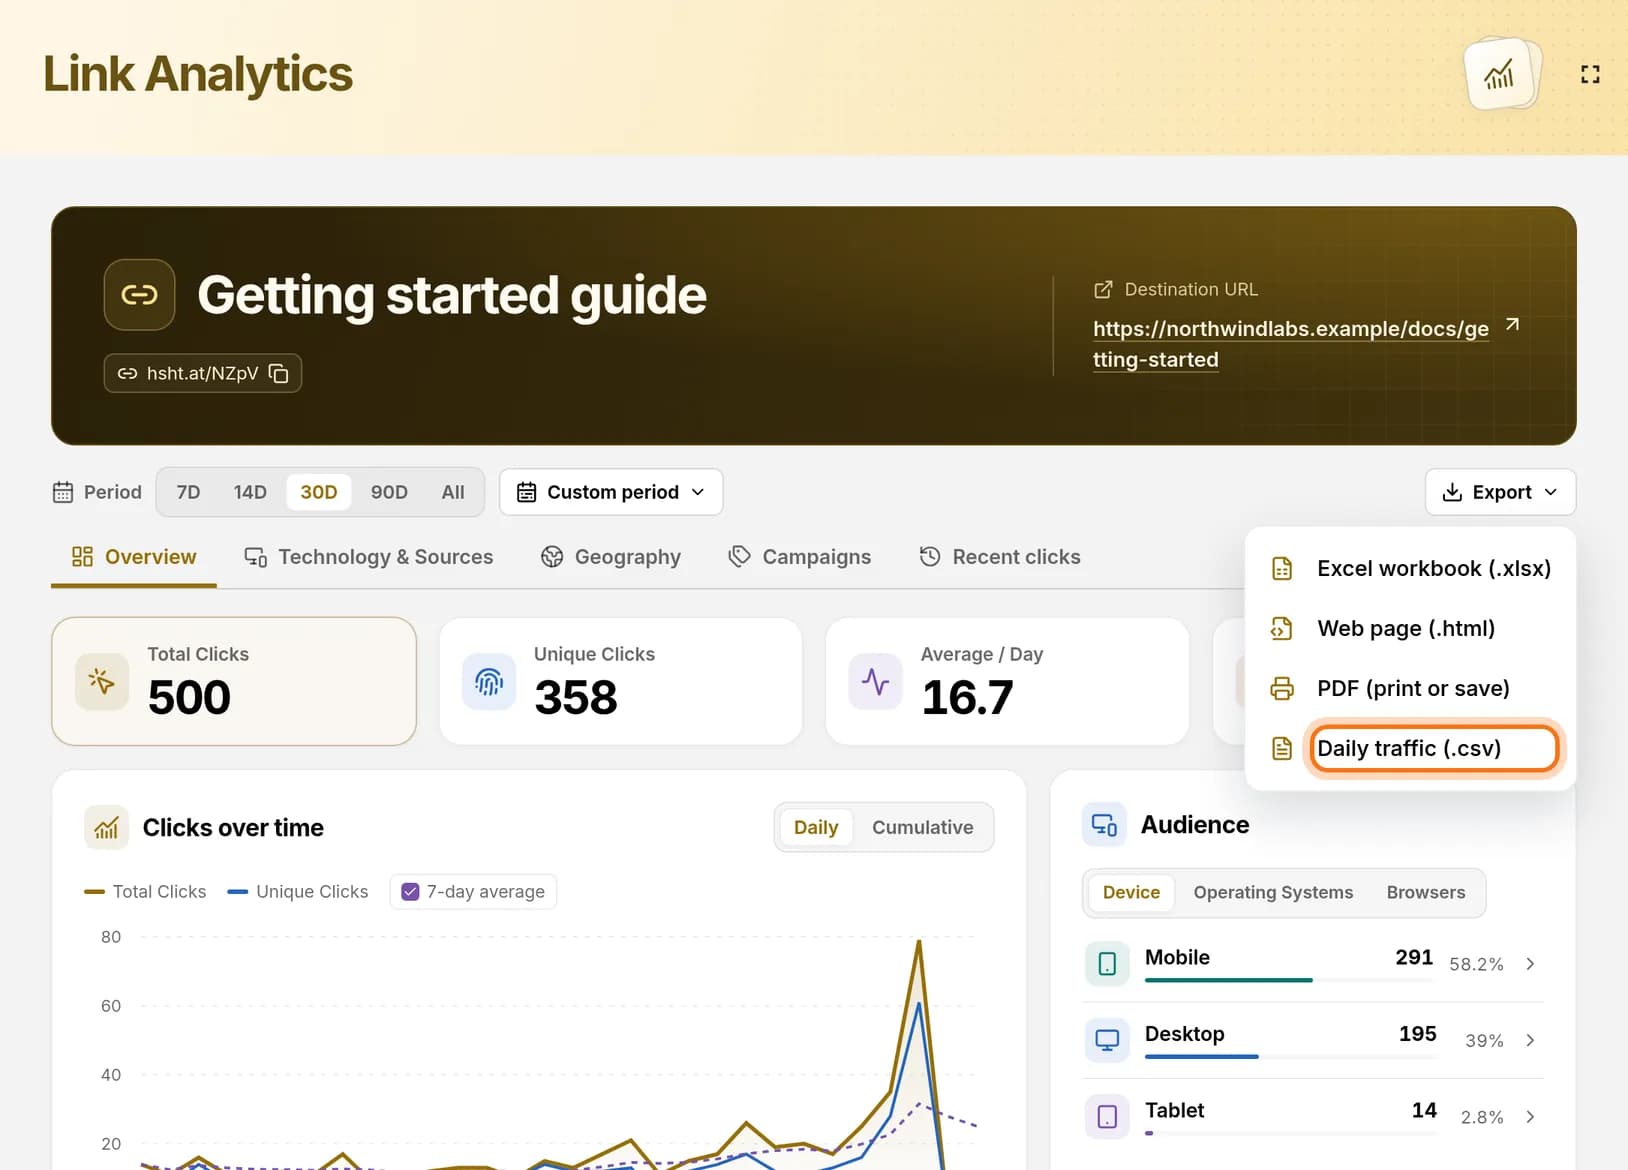
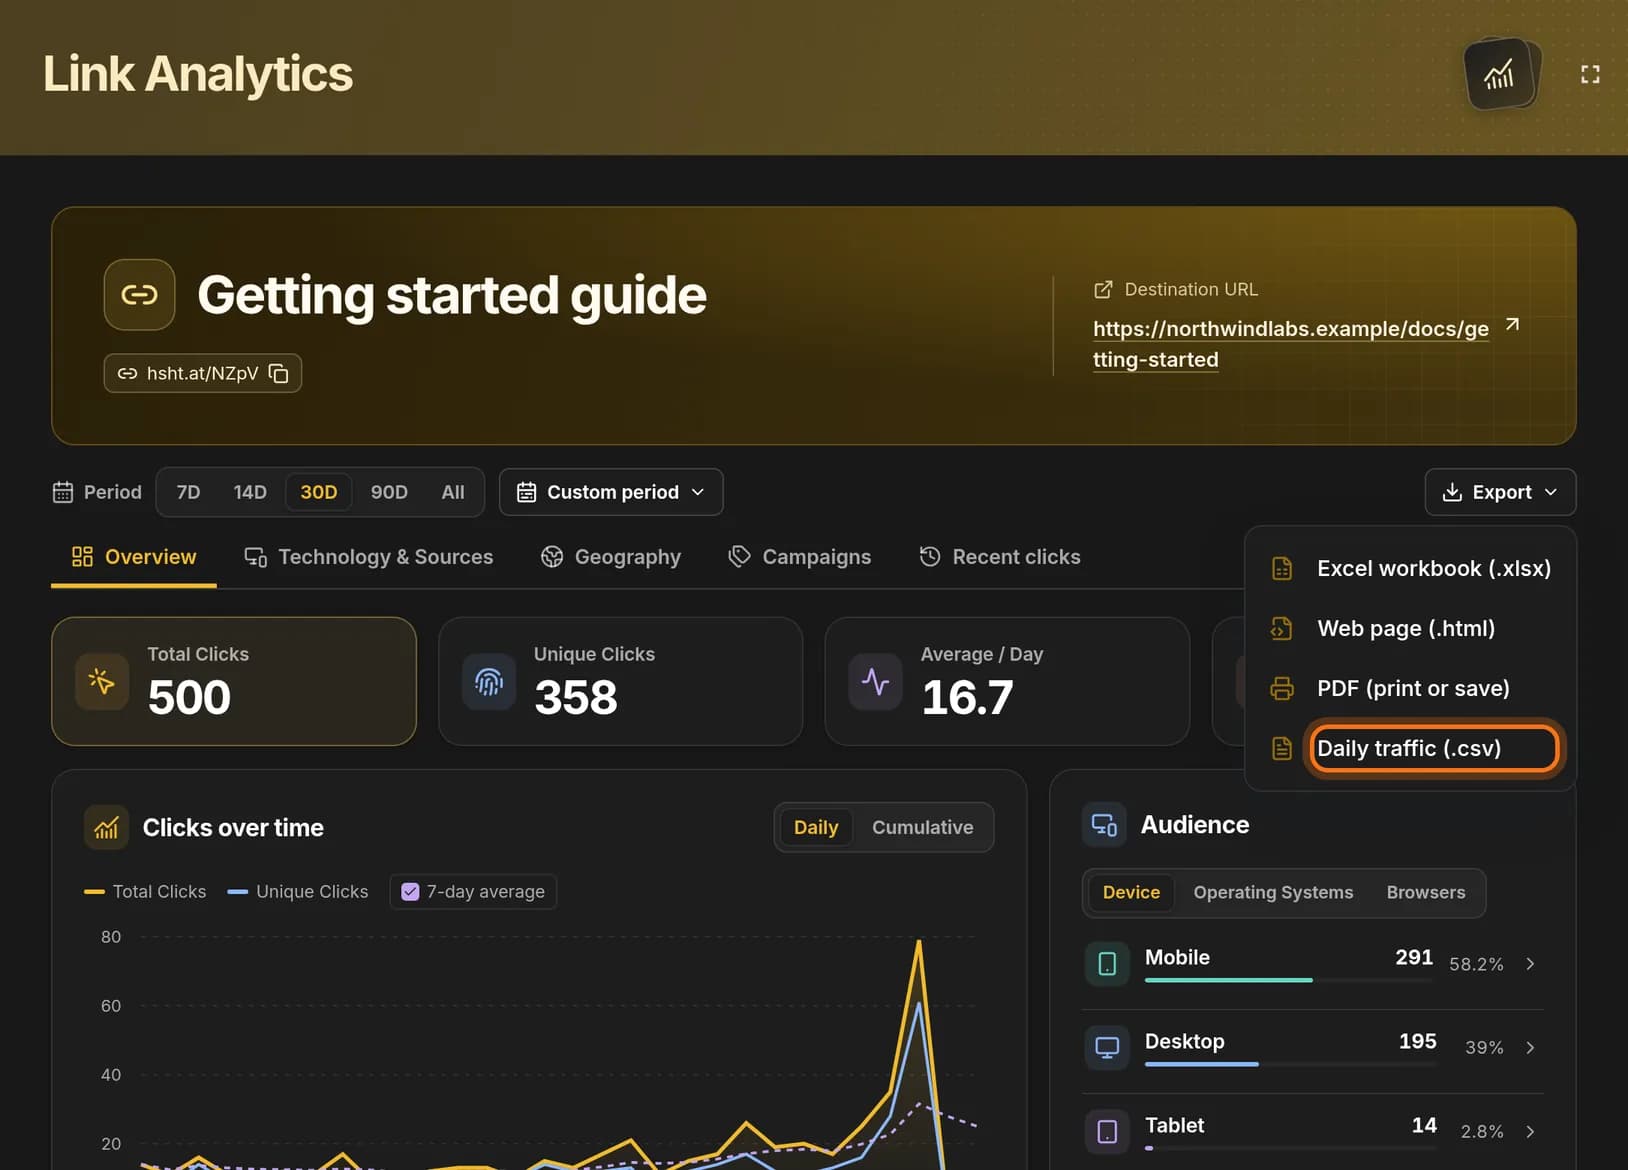
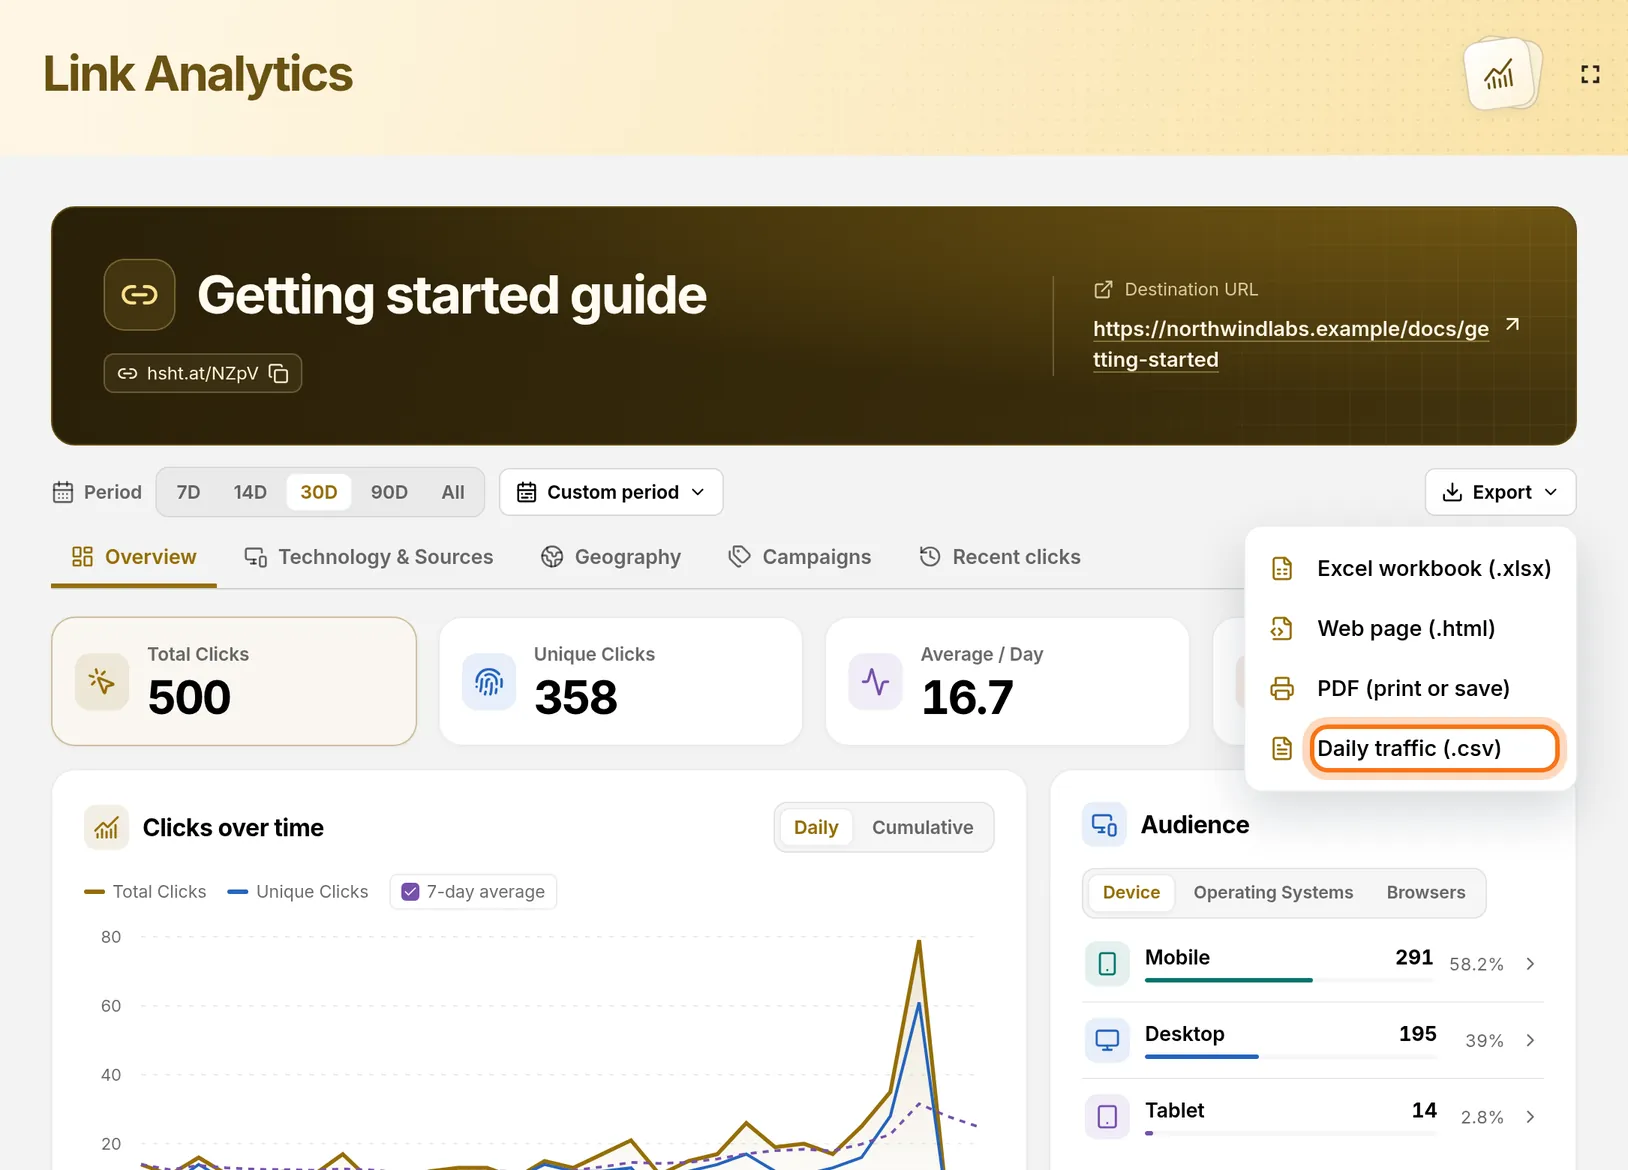
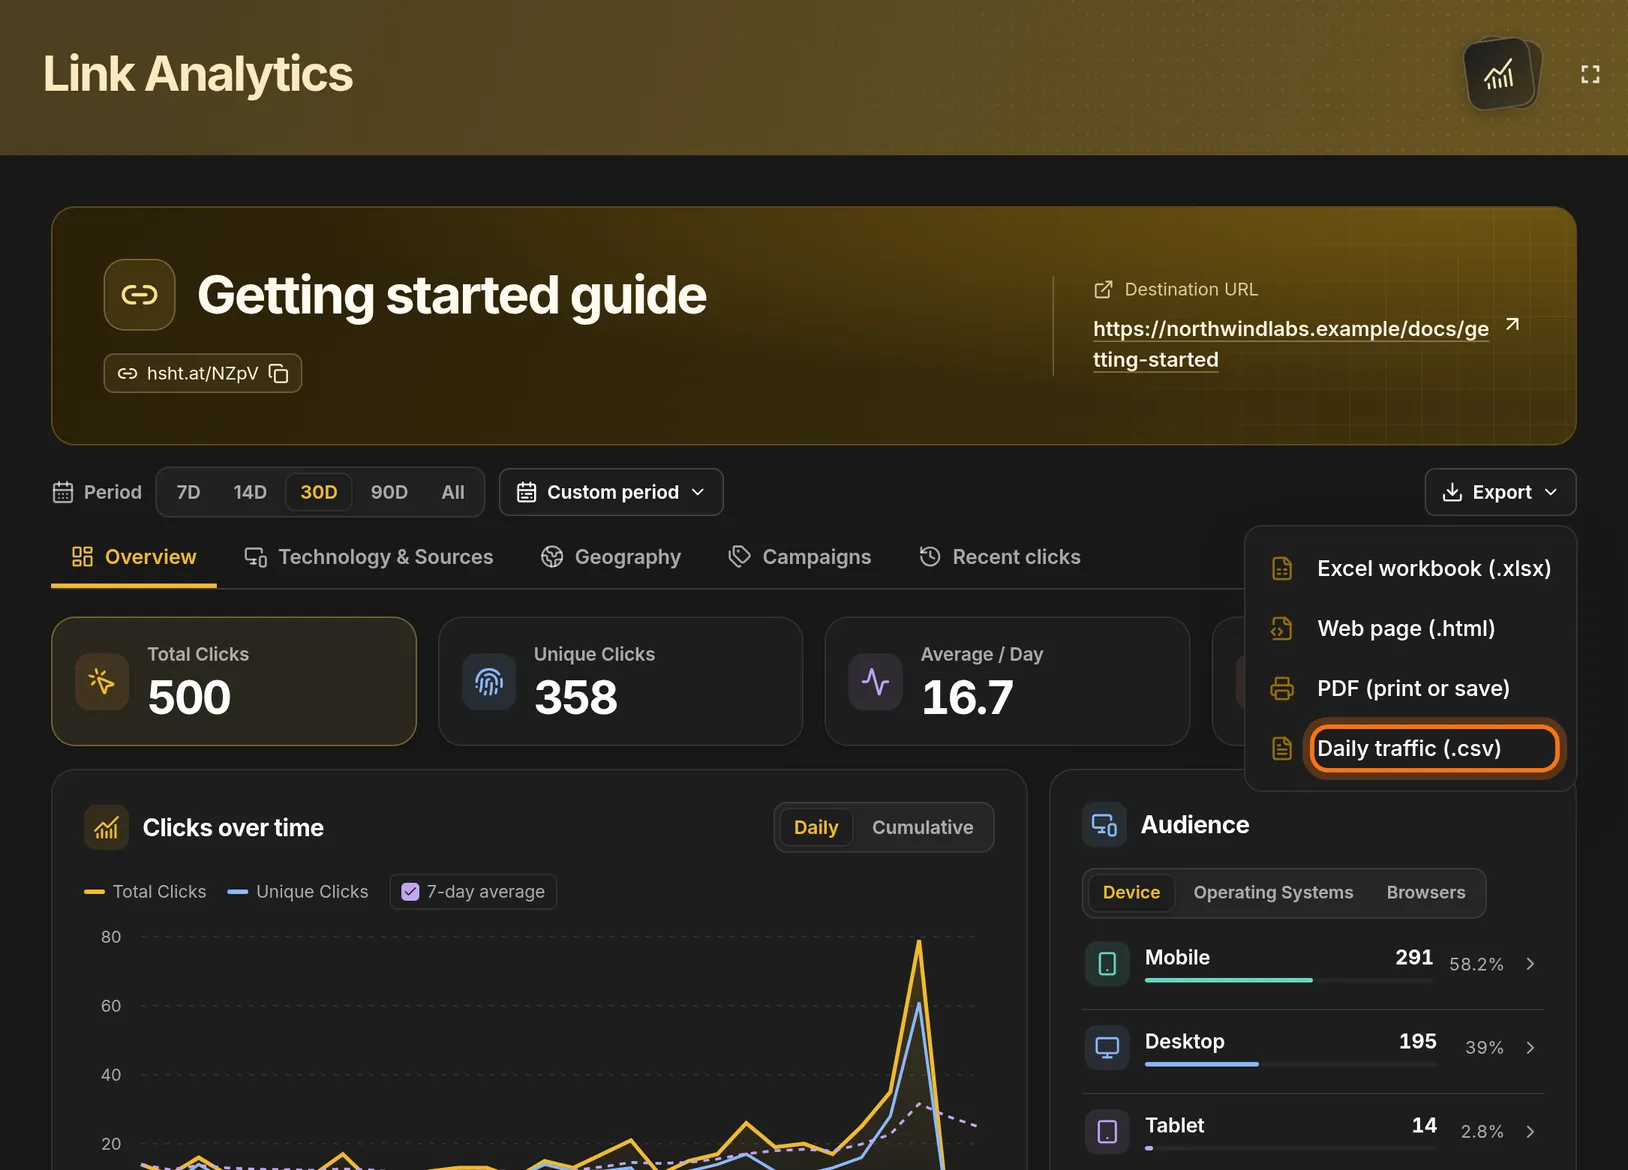
- Click Export at the right, on the same line as Period.
- Click Daily traffic (.csv) for one row per day.
- Open the downloaded file in your spreadsheet program.
You should see: A file with a row for each day and its clicks.
 Full size
 Full size
The export covers the period you selected. Choose Excel workbook (.xlsx) for the full report, or PDF (print or save) for a page you can send to someone.
Check it worked
- You know the link’s total clicks, unique clicks and busiest day for your period.
- The busiest day in the downloaded file is the same date as Peak Day on the page.
If something looks different
Every number is zero
The link has no clicks in the selected period. Click All next to Period to see its whole history.
I want to know where the clicks came from
Open the Geography tab for countries, and Technology & Sources for devices, browsers and referring websites.
Tip: On Clicks over time, switch from Daily to Cumulative to see how the total grew over the period.